Tag Archives: Java

Key concepts about using JProfiler

JProfiler is a tool for analyzing what is going on inside a JVM. E-J Technologies has developed this tool. The most common usage is for CPU Profiling or Memory analyzing. In this post, I want to detail a few key concepts about using JProfiler.

Every software developer has to use JProfiler or similar tools VisualVM or JDK bundled tools when improving the performance of an enterprise application. Previously, I had shown how to use JProfiler for performance testing.

JProfiler focuses on three different topics that can help developers to analyze their application.

  • Method Calls – This shows what your application is doing with method calls and where the performance can be improved.
  • Thread and Lock – To find any multi-threading issues, you should check the thread and lock analysis that JProfiler provides.
  • Allocations – You can analyze the objects on the heap, reference chains, and garbage collection. Therefore, it helps to fix memory leak issues.

JProfiler also provides database analysis that can help in understanding if there are any performance issues with database queries. I will not be covering that in this post.

JProfiler Settings

There are two ways you can collect data while using JProfiler.

  • Sampling – This does not necessarily provide the accuracy of the collected data. This feature doesn’t provide method-level statistics. The advantage of using this feature is that system performance is not affected when running JProfiler.
  • Instrumentation – This mode collects the entire data, but also heavy on performance affecting the application. The advantage is the accuracy of the data. If you are doing performance analysis, this should be your default choice even with the drawback, it provides large data that is helpful to analyze performance.

How to run JProfiler on a running application

JProfiler offers two modes to start the profiling of an application. If you run in local mode, you have to choose data collection mode when starting the JProfiler. In this mode, the application and JProfiler are running on the same machine. Usually not recommended.

In remote mode, you will start your JProfiler agent on a remote machine, probably the same machine where the application is running. And from your local JProfiler installation, you will connect to the JProfiler agent. To do this, you will need the IP address of the remote machine as well as the port where the JProfiler agent is running. In short, you are connecting JProfiler GUI to a remote JProfiler agent that is profiling your application.

How to analyze application performance using JProfiler

If you are running a performance test on your application, you will stop the profiling when the performance test stops. Once the profiling is complete, JProfiler GUI should provide a snapshot of the profiled data.

In this snapshot, we will have data for performance analysis number of objects generated, method calls, garbage collection, memory leaks. We will go through these key concepts from JProfiler snapshot data now.

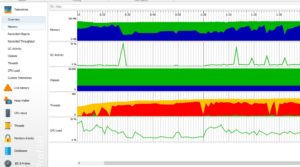
Overview page on Telemetries as shown below will give you an idea about metrics such as garbage collection activity, memory, threads, classes, and CPU load.

Key Concepts about using JProfiler

CPU Views

CPU views display the number of executions, call relationships of each method in the application. In CPU Views, you can find any specific method you suspect might be causing performance issues. This is a great view to analyze what might be the culprit in your application.

Call Tree

Call Tree shows hierarchical view of all the methods calls during the execution of your application. JProfiler helps with sorting the methods with their total execution times.

Key Concepts about using JProfiler

As shown above, we can see method to read data from Redis Cache is taking the most time.

Hot Spots

In the same view of CPU Views, there is an option for Hot Spots. This view can sort the methods based on various factors, such as individual execution time, total execution time, average execution time, and number of calls.

Live Memory

Live memory view shows memory allocation. This is where we can find if there is any memory leak.

Key concepts about using JProfiler - Live Memory

All Objects

All objects view will show all the objects that were created during execution of the application and size of these objects.


Conclusion

In this post, I showed how to some key concepts about using JProfiler for performance analysis. JProfiler is a powerful tool if used effectively. There are a lot of features in JProfiler and it can be overwhelming while using the tool. I hope this post will help you use JProfiler to analyze your application.

References

  1. JProfiler Introduction – JProfiler Introduction


Performance Monitoring with Spring Boot

In this post, I want to show some interesting features that Spring Boot offers for performance monitoring.

Once the application starts to scale, performance becomes the topmost priority. We over-optimize the application to lose simplicity. That’s how software development works. In a production scenario, we monitor our application for performance. With most applications moving to the cloud, it is essential to monitor the application and improve the performance constantly.

If you have used a spring actuator, it provides a number of statistics to monitor. Previously, I covered this topic Spring-Actuator.

Subsequently, we will be covering some different features of Spring Boot. We will be talking about CustomizableTraceInterceptor, PerformanceMonitorInterceptor, and CommonsRequestLoggingFilter.

Features for Performance Monitoring

Using CustomizableTraceInterceptor

You can add CustomizableTraceInterceptor as a Bean and use that Bean as an advisor for what expressions you want to intercept. Basically, this interceptor allows us to intercept the method calls and add custom log messages.

To show this in the working example, we will be tracking repository timings. Firstly, create a class that will extend CustomizableTraceInterceptor as follows:


package com.abccompany.home.performance;

import org.aopalliance.intercept.MethodInvocation;
import org.apache.commons.logging.Log;
import org.springframework.aop.framework.AopProxyUtils;
import org.springframework.aop.interceptor.CustomizableTraceInterceptor;
import org.springframework.data.jpa.repository.support.SimpleJpaRepository;

public class RepositoryMethodInterceptor extends CustomizableTraceInterceptor
{
    @Override
    protected Class<?> getClassForLogging(Object target)
    {
        Class<?> classForLogging = super.getClassForLogging(target);
        if (SimpleJpaRepository.class.equals(classForLogging))
        {
            Class<?>[] interfaces = AopProxyUtils.proxiedUserInterfaces(target);
            if (interfaces.length > 0)
            {
                return interfaces[0];
            }
        }
        return classForLogging;
    }


    protected void writeToLog(Log logger, String message, Throwable ex)
    {
        if (ex != null)
        {
            logger.info(message, ex);
        }
        else
        {
            logger.info(message);
        }
    }

    protected boolean isInterceptorEnabled(MethodInvocation invocation, Log logger)
    {
        return true;
    }

}

Likewise, I will explain in a bit what this class is doing. We need a @Bean that will use this interceptor to intercept repository methods. The code for this will look like below:


package com.abccompany.home.performance;

import org.springframework.aop.Advisor;
import org.springframework.aop.aspectj.AspectJExpressionPointcut;
import org.springframework.aop.support.DefaultPointcutAdvisor;
import org.springframework.context.annotation.Bean;
import org.springframework.context.annotation.Configuration;
import org.springframework.context.annotation.EnableAspectJAutoProxy;

@Configuration
@EnableAspectJAutoProxy(proxyTargetClass = true)
public class TraceLoggerConfig
{
    @Bean
    public RepositoryMethodInterceptor repositoryMethodInterceptor()
    {
        RepositoryMethodInterceptor repositoryMethodInterceptor = new RepositoryMethodInterceptor();
        repositoryMethodInterceptor.setHideProxyClassNames(true);
        repositoryMethodInterceptor.setUseDynamicLogger(false);
        repositoryMethodInterceptor.setExitMessage("Executed $[methodName] in $[invocationTime] " +
                "ms");
        return repositoryMethodInterceptor;
    }

    @Bean
    public Advisor advisor()
    {
        AspectJExpressionPointcut aspectJExpressionPointcut = new AspectJExpressionPointcut();
        aspectJExpressionPointcut.setExpression("execution(public * com.abccompany.home" +
                ".repositories.*Repository+.*(..))");
        return new DefaultPointcutAdvisor(aspectJExpressionPointcut, repositoryMethodInterceptor());
    }
}

Now if we look at this configuration, this is creating a bean for using RepositoryMethodInterceptor which is a subclass of CustomizableTraceInterceptor. You can see we have used an exit message to log the timing that the repository method took in this bean.


repositoryMethodInterceptor.setExitMessage("Executed $[methodName] in $[invocationTime] " + "ms");

AspectJExpression creates an expression for which the packages interception should happen. The class RepositoryMethodInterceptor does a few useful things. Firstly, it helps us to track the class information of Repository classes. Secondly, it logs the message in our log file. Once you run the application, you will see the log messages as below:


2020-05-24 19:08:04.870 INFO 14724 --- [nio-8443-exec-9] c.r.h.p.RepositoryMethodInterceptor : Entering method 'findUserByEmail' of class [com.abccompany.home.repositories.UserdataRepository] Hibernate: select userdata0_.id as id1_4_, userdata0_.email as email2_4_, userdata0_.firstname as firstnam3_4_, userdata0_.guid as guid4_4_, userdata0_.lastname as lastname5_4_, userdata0_.middlename as middlena6_4_, userdata0_.confirmpassword as confirmp7_4_, userdata0_.passwordtxt as password8_4_, userdata0_.phonenumber as phonenum9_4_, userdata0_.role as role10_4_ from userdata userdata0_ where userdata0_.email=? 
2020-05-24 19:08:04.872 INFO 14724 --- [nio-8443-exec-9] c.r.h.p.RepositoryMethodInterceptor : Executed findUserByEmail in 2 ms 
2020-05-24 19:08:04.872 INFO 14724 --- [nio-8443-exec-9] c.r.h.p.RepositoryMethodInterceptor : Entering method 'findAll' of class [com.abccompany.home.repositories.FeedbackRepository] Hibernate: select feedback0_.id as id1_1_, feedback0_.createdon as createdo2_1_, feedback0_.fromdate as fromdate3_1_, feedback0_.guid as guid4_1_, feedback0_.rating as rating5_1_, feedback0_.rentalpropertyid as rentalpr8_1_, feedback0_.review as review6_1_, feedback0_.todate as todate7_1_, feedback0_.userid as userid9_1_ from feedback feedback0_ 
2020-05-24 19:08:04.876 INFO 14724 --- [nio-8443-exec-9] c.r.h.p.RepositoryMethodInterceptor : Executed findAll in 4 ms

Using PerformanceMonitorInterceptor feature

So, in order to use PerformanceMonitorInterceptor , we will create a configuration class and add a bean that will create PerformanceMonitorInterceptor. AspectJExpressionPointcut will point to the expression that will evaluate our controller classes.

Like CustomizableTraceInterceptor, we will have a subclass that will extend PerformanceMonitoringInterceptor so we can log our messages in Spring Boot logging. This will look like below:


package com.abccompany.home.performance;

import org.aopalliance.intercept.MethodInvocation;
import org.apache.commons.logging.Log;
import org.springframework.aop.interceptor.PerformanceMonitorInterceptor;


public class ControllerMonitoringInterceptor extends PerformanceMonitorInterceptor
{
    protected void writeToLog(Log logger, String message, Throwable ex)
    {
        if (ex != null)
        {
            logger.info(message, ex);
        }
        else
        {
            logger.info(message);
        }
    }

    protected boolean isInterceptorEnabled(MethodInvocation invocation, Log logger)
    {
        return true;
    }
}

We will create a bean for ControllerMonitoringInterceptor . This bean will be part of our logger configuration which will also evaluate AspectJExpression for Controller classes. Therefore, it will look like below:


package com.abccompany.home.performance;

import org.aspectj.lang.annotation.Aspect;
import org.aspectj.lang.annotation.Pointcut;
import org.springframework.aop.Advisor;
import org.springframework.aop.aspectj.AspectJExpressionPointcut;
import org.springframework.aop.interceptor.PerformanceMonitorInterceptor;
import org.springframework.aop.support.DefaultPointcutAdvisor;
import org.springframework.context.annotation.Bean;
import org.springframework.context.annotation.Configuration;
import org.springframework.context.annotation.EnableAspectJAutoProxy;

@Configuration
@EnableAspectJAutoProxy
@Aspect
public class ControllerLoggerConfig
{
    @Pointcut("execution(* com.abccompany.home.controllers.*Controller+.*(..))")
    public void monitor()
    {

    }

    @Bean
    public ControllerMonitoringInterceptor controllerMonitoringInterceptor()
    {
        return new ControllerMonitoringInterceptor();
    }

    @Bean
    public Advisor advisorPerformance()
    {
        AspectJExpressionPointcut aspectJExpressionPointcut = new AspectJExpressionPointcut();
        aspectJExpressionPointcut.setExpression("com.abccompany.home.performance" +
                ".ControllerLoggerConfig.monitor()");
        return new DefaultPointcutAdvisor(aspectJExpressionPointcut,
                controllerMonitoringInterceptor());
    }
}

Now if we execute the application, the log messages will show latencies for Controller classes.


2020-05-24 20:12:09.237  INFO 9280 --- [nio-8443-exec-6] c.r.h.p.ControllerMonitoringInterceptor  : StopWatch 'com.abccompany.home.controllers.LoginController.signin': running time (millis) = 0
2020-05-24 20:12:18.263  INFO 9280 --- [nio-8443-exec-2] c.r.h.p.ControllerMonitoringInterceptor  : StopWatch 'com.abccompany.home.controllers.MainController.home': running time (millis) = 43
2020-05-24 20:12:20.025  INFO 9280 --- [nio-8443-exec-9] c.r.h.p.ControllerMonitoringInterceptor  : StopWatch 'com.abccompany.home.controllers.MainController.logout': running time (millis) = 12
2020-05-24 20:12:20.042  INFO 9280 --- [nio-8443-exec-5] c.r.h.p.ControllerMonitoringInterceptor  : StopWatch 'com.abccompany.home.controllers.LoginController.login': running time (millis) = 0

How to use CommonsRequestLoggingFilter

Additionally, Spring Boot offers one useful feature of logging incoming requests. This helps in monitoring the application and to see how the requests are coming. To use this feature, we will create a @Configuration class RequestLoggingFilter as below:


package com.abccompany.home.performance;


import org.springframework.context.annotation.Bean;
import org.springframework.context.annotation.Configuration;
import org.springframework.web.filter.AbstractRequestLoggingFilter;
import org.springframework.web.filter.CommonsRequestLoggingFilter;

import javax.servlet.http.HttpServletRequest;

@Configuration
public class RequestLoggingFilter extends AbstractRequestLoggingFilter
{
    @Bean
    public CommonsRequestLoggingFilter requestLoggingFilterConfig()
    {
        CommonsRequestLoggingFilter commonsRequestLoggingFilter = new CommonsRequestLoggingFilter();
        commonsRequestLoggingFilter.setIncludeClientInfo(true);
        commonsRequestLoggingFilter.setIncludeQueryString(true);
        commonsRequestLoggingFilter.setIncludePayload(true);
        return commonsRequestLoggingFilter;
    }

    @Override
    protected void beforeRequest (HttpServletRequest request, String message)
    {
        logger.info(message);
    }

    @Override
    protected void afterRequest (HttpServletRequest request, String message)
    {
        logger.info(message);
    }
}

Once, we add this, we will see beforeRequest and afterRequest messages in the log as below:


2020-05-24 21:07:15.161  INFO 11984 --- [nio-8443-exec-1] gFilter$$EnhancerBySpringCGLIB$$cb4fdaab : Before request [uri=/css/bootstrap.min.css]
2020-05-24 21:07:15.171  INFO 11984 --- [nio-8443-exec-2] gFilter$$EnhancerBySpringCGLIB$$cb4fdaab : Before request [uri=/js/jquery.min.js]
2020-05-24 21:07:15.203  INFO 11984 --- [nio-8443-exec-7] gFilter$$EnhancerBySpringCGLIB$$cb4fdaab : Before request [uri=/js/bootstrap.min.js]
2020-05-24 21:07:15.290  INFO 11984 --- [nio-8443-exec-7] gFilter$$EnhancerBySpringCGLIB$$cb4fdaab : After request [uri=/js/bootstrap.min.js]
2020-05-24 21:07:15.306  INFO 11984 --- [nio-8443-exec-2] gFilter$$EnhancerBySpringCGLIB$$cb4fdaab : After request [uri=/js/jquery.min.js]
2020-05-24 21:07:15.318  INFO 11984 --- [nio-8443-exec-1] gFilter$$EnhancerBySpringCGLIB$$cb4fdaab : After request [uri=/css/bootstrap.min.css]

Conclusion

In conclusion, I showed three features for performance monitoring – CustomizableTraceInterceptor, PerformanceMonitorInterceptor, and CommonsRequestLoggingFilter to log useful performance metrics.

References

  1. Spring Framework Features
  2. CommonsRequestLoggingFilter


Error with Spring Context Lookup Failed

In this post, I will show how to resolve the error Spring context lookup failed. This scenario resembles if you are using Spring Boot 2.x or Spring Boot 1.5. I was recently using Spring Boot 2.x and ran into an error like below:

org.glassfish.jersey.server.spring.SpringComponentProvider: Spring context lookup failed, 
skipping spring component provider initialization.


Why did I see this error?

Before I can explain why I saw this error. Let’s sort of some basic concepts about what  ContextLoaderListner is and what DispatcherServlet is.

Spring boot creates multiple contexts. It will start with a root context and the rest of the contexts will be child contexts. Child contexts can access the beans defined in the root context, but not vice versa.

ContextLoaderListener

When you start the Spring Boot application, ContextLoaderListener creates the root application context. Spring boot will share this root context with all other child contexts that DispatcherServlet will create. Usually, you define ContextLoaderListener in web.xml like below:


<listener>
  <listener-class>
    org.springframework.web.context.ContextLoaderListener
  </listener-class>
</listener>
  
<context-param>
  <param-name>contextConfigLocation</param-name>
  <param-value>/WEB-INF/spring/applicationContext.xml</param-value>
</context-param>

ServletContext stores this root application context and one can use WebApplicationContextUtils to retrieve this context.

DispatcherServlet

DispatcherServlet is a HttpServlet whose primary purpose is to handle incoming web requests matching the configured URL pattern. When you define DispatcherServlet in Spring configuration, Spring will use a configured configuration file or creates its own configuration file based on controllers and views in the code.

DispatcherServlet creates one child application context per servlet entry.

Why Spring Context Lookup Failed:

Spring Boot 2.x offers a programmatic way to configure your contexts and servlets. In my particular case, I was using this programmatic way. But I had configured anyway to load application context, especially root application context.

To configure this root application context, I needed ContextLoaderListener . Since I didn’t want to use web.xml , I looked for a programmatic way. Spring boot 2.x offers this through SpringBootServletInitializer . Basically, when we extend the root application class with SpringBootServletInitializer, it binds Servlet, Filter, and ServletInitializer beans from the application context to the server. This also allows us to create a WAR archive of our application and run in any web container.

Once I added SpringBootServletInitializer in my main Spring Boot Application class, I was able to resolve this error. The code for that will look like below:


@SpringBootApplication
public class Application extends SpringBootServletInitializer 
{    
    public static void main(String[] args) 
    {
        SpringApplication sa = new SpringApplication(Application.class);
        sa.run(args);
    }
}


Conclusion

In this post, we showed how we can resolve an error Spring Context Lookup Failed. If you have any feedback about this post, please comment and I will be happy to answer.

References

  1. ContextLoaderListener vs DispatcherServlet
  2. Spring Boot Servlet Initializer
  3. Upgrade Spring Boot and adding Spring Boot Actuator – Spring Boot Actuator


RentersFeedback.com is Rentersvoices.com

Yes, yes, Rentersfeedback.com is Rentersvoices.com. Previously I described how I came up with an idea to create an application here. I am rebranding RentersFeedback to RentersVoices. I was actually looking for that domain for some time now, finally, when I was able to get the domain, I immediately made the shift.

Why Rebranding?

You can argue that rebranding RentersFeedback to RentersVoices seems unnecessary, but I always had a hint that I needed this domain. Even when I was launching Rentersfeedback.com, I was looking for the domain rentersvoices.com and I never got it. It was taken.

  1. Renters Voices is a better name. Renters Feedback sounds very forced name.
  2. Now I can implement a few more ideas that I have in mind based on rentersvoices name.
  3. I also received good feedback from Indiehackers.com here.

Domain names are not easily available. Sometimes, it takes a lot of time to constantly look for a domain that you want. When I started building an application, I looked for rentervoices.com, but it wasn’t available. Now when I got the right domain, it was no no-brainer to rebrand my application to rentersvoices.com.

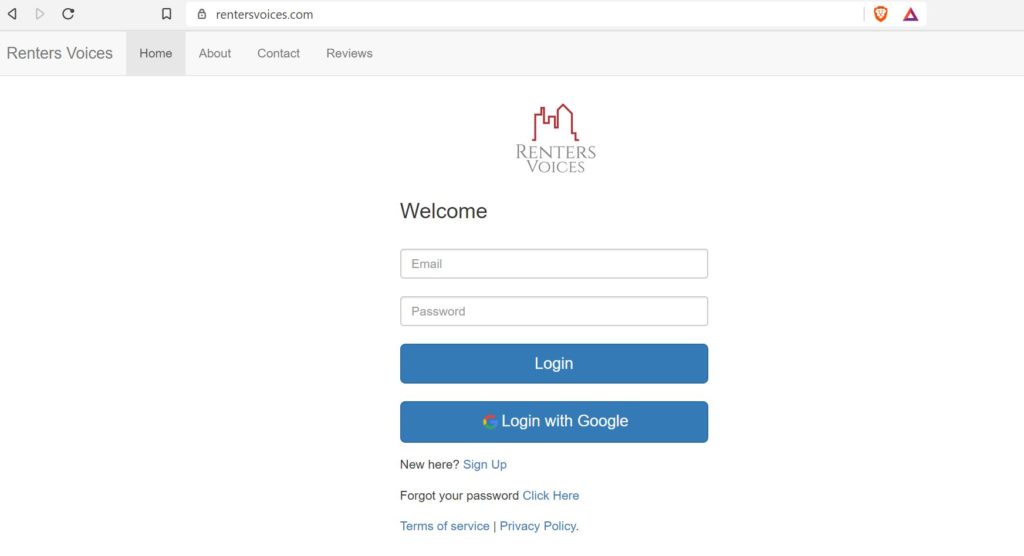
Domain Change To RentersVoices

Marketing

At Indie Hackers meetup, I got a few marketing ideas from experienced indie hackers. Especially I really liked the idea to use flyers and talk to people at university campuses and ask them to post reviews.

I hope the rebranding will help me take that risk with marketing and get more leverage to push forward.

A few other ways to market the application are

  • To join some of the Facebook groups where they post about rental properties. Ask the people to submit reviews
  • Reddit communities can be equally helpful to get some feedback.
  • Talk to renters and people. Talking to people is the oldest form of marketing.

So sign up at rentersvoices.com and post a review about your rental apartment or house.


How to integrate reCaptcha with Spring Boot Application

In this post, I want to show how to integrate ReCaptcha in a Spring Boot application. This will be an important step if you have forms in your application and if those forms are publicly available on the internet. You can face a lot of spams or bots trying to fill those forms. To avoid these spams from bots, ReCaptcha is of utmost importance.

Google offers a reCaptcha service that we will integrate with Spring Boot application to stop bots from submitting the forms in our application.

Registration with Google for ReCaptcha

Google offers a reCaptcha service that developers can use in their applications. As part of this implementation, we will register our service in Google APIs so that Google can provide us credentials to use while calling its service.

We can register our site at Google Recaptcha Administration. This registration will provide us with site-key and site-secret.

Now as part of Spring boot application, we can store these credentials in application.properties file as below:

# ====================================================================================
# Google reCaptcha Settings
# ====================================================================================
google.recaptcha.key.site=site-key
google.recaptcha.key.secret=site-secret

We will make these properties available through a spring bean object in our application, so we can use them when we call Google Recaptcha Service.

UI changes to display ReCaptcha box

Now to display Recaptcha box on your form, we will add the following code in our templates where our public form resides. In this case, I am putting Recaptcha box in Contact Us and Sign Up pages as those are publicly available forms.

<!DOCTYPE html>
<html xmlns="http://www.w3.org/1999/xhtml"
      xmlns:th="http://www.thymeleaf.org">

<head>
    <meta http-equiv="Content-Type" content="text/html; charset=ISO-8859-1" />
    <title>Renters Feedback</title>

    <!-- other scripts and stylesheets -->
    <script src='https://www.google.com/recaptcha/api.js'></script>

</head>
<body>

<form method = "post" id="contactus" th:action="@{/contact}">
<!--- other code to display contact us form -->
<div class="g-recaptcha" th:attr="data-sitekey=${@captchaSettings.getSite()}"></div><br/><br/>
<span id="captchaError" class="alert alert-danger col-sm-4" style="display:none"></span>
</form>

</body>
</html>


Server-side handling of ReCaptcha

So as we have a widget on our form. When a user completes a challenge and submits the form, the request will be sent to the server containing an encoded site key and a unique string that identifies user’s challenge completion.

But on the server side, we can’t just assume and trust what the user has submitted. So we need to verify this captcha challenge by sending a request to Google API at https://www.google.com/recaptcha/api/siteverify by passing captcha response we have received.

If the verification is successful, the json response from API will contain a success parameter.

If the verification fails, then an application will throw an exception and reCaptcha library will instruct a client to create a new challenge.

One thing to understand here is that we limit how many attempts a client can make to reCaptcha challenge. The reason for this is to avoid any kind of DoS attack. Of course, this is precautionary and elementary step. We implement ReCaptchaAttemptService to block if a client tries to use the challenge for more than 4 attempts.

Demo of the complete workflow of ReCaptcha

Conclusion

In this post, we showed how we can use google reCaptcha service to integrate a reCaptcha widget in a form that is publicly available to avoid bots spams. From the security perspective, this is an important step and developers should take into account this important feature for their web applications.

References

  1. Recaptcha with Spring Boot Application – Recaptcha With Spring Boot Application
  2. Protecting Spring Boot application with Google Recaptcha – Protecting Spring Boot Application