JProfiler is a tool for analyzing what is going on inside a JVM. E-J Technologies has developed this tool. The most common usage is for CPU Profiling or Memory analyzing. In this post, I want to detail a few key concepts about using JProfiler.
Every software developer has to use JProfiler or similar tools VisualVM or JDK bundled tools when improving the performance of an enterprise application. Previously, I had shown how to use JProfiler for performance testing.
JProfiler focuses on three different topics that can help developers to analyze their application.
- Method Calls – This shows what your application is doing with method calls and where the performance can be improved.
- Thread and Lock – To find any multi-threading issues, you should check the thread and lock analysis that JProfiler provides.
- Allocations – You can analyze the objects on the heap, reference chains, and garbage collection. Therefore, it helps to fix memory leak issues.
JProfiler also provides database analysis that can help in understanding if there are any performance issues with database queries. I will not be covering that in this post.
JProfiler Settings
There are two ways you can collect data while using JProfiler.
- Sampling – This does not necessarily provide the accuracy of the collected data. This feature doesn’t provide method-level statistics. The advantage of using this feature is that system performance is not affected when running JProfiler.
- Instrumentation – This mode collects the entire data, but also heavy on performance affecting the application. The advantage is the accuracy of the data. If you are doing performance analysis, this should be your default choice even with the drawback, it provides large data that is helpful to analyze performance.
How to run JProfiler on a running application
JProfiler offers two modes to start the profiling of an application. If you run in local mode, you have to choose data collection mode when starting the JProfiler. In this mode, the application and JProfiler are running on the same machine. Usually not recommended.
In remote mode, you will start your JProfiler agent on a remote machine, probably the same machine where the application is running. And from your local JProfiler installation, you will connect to the JProfiler agent. To do this, you will need the IP address of the remote machine as well as the port where the JProfiler agent is running. In short, you are connecting JProfiler GUI to a remote JProfiler agent that is profiling your application.
How to analyze application performance using JProfiler
If you are running a performance test on your application, you will stop the profiling when the performance test stops. Once the profiling is complete, JProfiler GUI should provide a snapshot of the profiled data.
In this snapshot, we will have data for performance analysis number of objects generated, method calls, garbage collection, memory leaks. We will go through these key concepts from JProfiler snapshot data now.
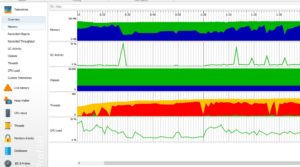
Overview page on Telemetries as shown below will give you an idea about metrics such as garbage collection activity, memory, threads, classes, and CPU load.
CPU Views
CPU views display the number of executions, call relationships of each method in the application. In CPU Views, you can find any specific method you suspect might be causing performance issues. This is a great view to analyze what might be the culprit in your application.
Call Tree
Call Tree shows hierarchical view of all the methods calls during the execution of your application. JProfiler helps with sorting the methods with their total execution times.
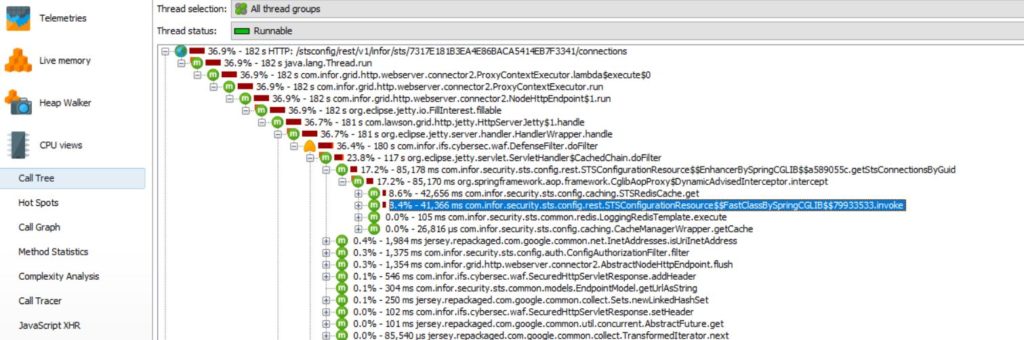
As shown above, we can see method to read data from Redis Cache is taking the most time.
Hot Spots
In the same view of CPU Views, there is an option for Hot Spots. This view can sort the methods based on various factors, such as individual execution time, total execution time, average execution time, and number of calls.
Live Memory
Live memory view shows memory allocation. This is where we can find if there is any memory leak.
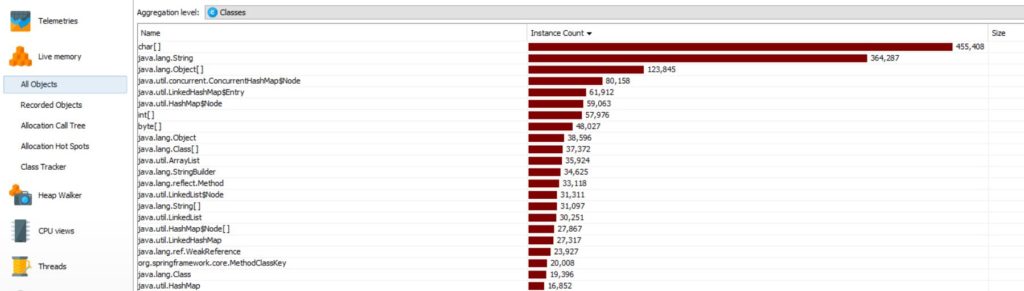
All Objects
All objects view will show all the objects that were created during execution of the application and size of these objects.
Conclusion
In this post, I showed how to some key concepts about using JProfiler for performance analysis. JProfiler is a powerful tool if used effectively. There are a lot of features in JProfiler and it can be overwhelming while using the tool. I hope this post will help you use JProfiler to analyze your application.
References
- JProfiler Introduction – JProfiler Introduction