JProfiler is a tool for analyzing what is going on inside a JVM. E-J Technologies has developed this tool. The most common usage is for CPU Profiling or Memory analyzing. In this post, I want to detail a few key concepts about using JProfiler.
Every software developer has to use JProfiler or similar tools VisualVM or JDK bundled tools when improving the performance of an enterprise application. Previously, I had shown how to use JProfiler for performance testing.
JProfiler focuses on three different topics that can help developers to analyze their application.
Method Calls – This shows what your application is doing with method calls and where the performance can be improved.
Thread and Lock – To find any multi-threading issues, you should check the thread and lock analysis that JProfiler provides.
Allocations – You can analyze the objects on the heap, reference chains, and garbage collection. Therefore, it helps to fix memory leak issues.
JProfiler also provides database analysis that can help in understanding if there are any performance issues with database queries. I will not be covering that in this post.
JProfiler Settings
There are two ways you can collect data while using JProfiler.
Sampling – This does not necessarily provide the accuracy of the collected data. This feature doesn’t provide method-level statistics. The advantage of using this feature is that system performance is not affected when running JProfiler.
Instrumentation – This mode collects the entire data, but also heavy on performance affecting the application. The advantage is the accuracy of the data. If you are doing performance analysis, this should be your default choice even with the drawback, it provides large data that is helpful to analyze performance.
How to run JProfiler on a running application
JProfiler offers two modes to start the profiling of an application. If you run in local mode, you have to choose data collection mode when starting the JProfiler. In this mode, the application and JProfiler are running on the same machine. Usually not recommended.
In remote mode, you will start your JProfiler agent on a remote machine, probably the same machine where the application is running. And from your local JProfiler installation, you will connect to the JProfiler agent. To do this, you will need the IP address of the remote machine as well as the port where the JProfiler agent is running. In short, you are connecting JProfiler GUI to a remote JProfiler agent that is profiling your application.
How to analyze application performance using JProfiler
If you are running a performance test on your application, you will stop the profiling when the performance test stops. Once the profiling is complete, JProfiler GUI should provide a snapshot of the profiled data.
In this snapshot, we will have data for performance analysis number of objects generated, method calls, garbage collection, memory leaks. We will go through these key concepts from JProfiler snapshot data now.
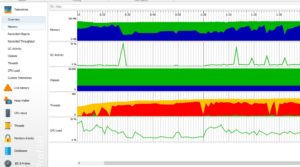
Overview page on Telemetries as shown below will give you an idea about metrics such as garbage collection activity, memory, threads, classes, and CPU load.
CPU Views
CPU views display the number of executions, call relationships of each method in the application. In CPU Views, you can find any specific method you suspect might be causing performance issues. This is a great view to analyze what might be the culprit in your application.
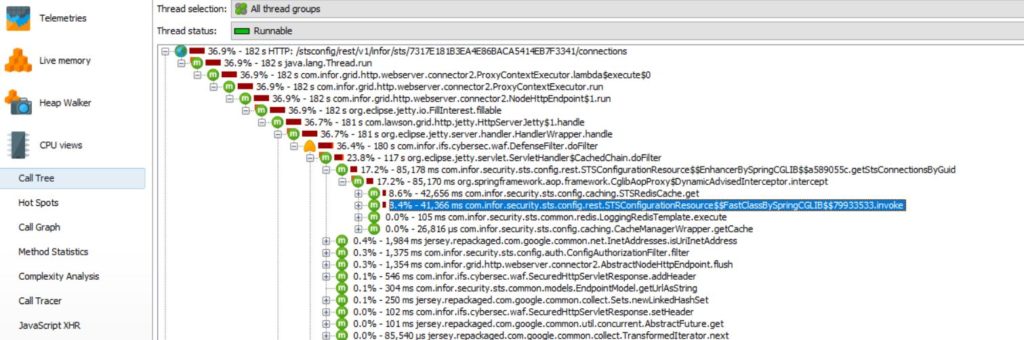
Call Tree
Call Tree shows hierarchical view of all the methods calls during the execution of your application. JProfiler helps with sorting the methods with their total execution times.
As shown above, we can see method to read data from Redis Cache is taking the most time.
Hot Spots
In the same view of CPU Views, there is an option for Hot Spots. This view can sort the methods based on various factors, such as individual execution time, total execution time, average execution time, and number of calls.
Live Memory
Live memory view shows memory allocation. This is where we can find if there is any memory leak.
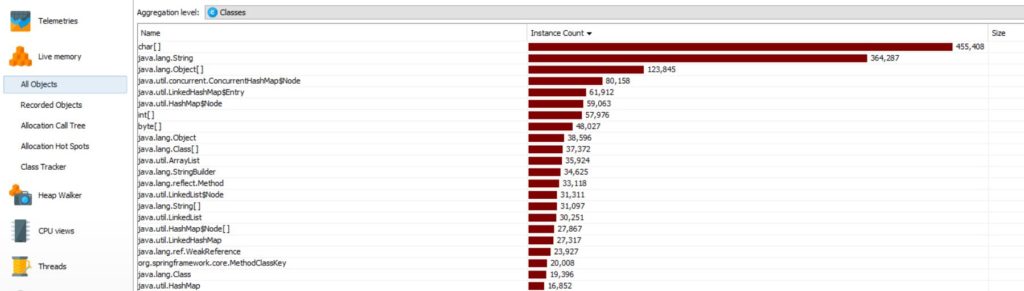
All Objects
All objects view will show all the objects that were created during execution of the application and size of these objects.
Conclusion
In this post, I showed how to some key concepts about using JProfiler for performance analysis. JProfiler is a powerful tool if used effectively. There are a lot of features in JProfiler and it can be overwhelming while using the tool. I hope this post will help you use JProfiler to analyze your application.
In this post, I want to show some interesting features that Spring Boot offers for performance monitoring.
Once the application starts to scale, performance becomes the topmost priority. We over-optimize the application to lose simplicity. That’s how software development works. In a production scenario, we monitor our application for performance. With most applications moving to the cloud, it is essential to monitor the application and improve the performance constantly.
If you have used a spring actuator, it provides a number of statistics to monitor. Previously, I covered this topic Spring-Actuator.
Subsequently, we will be covering some different features of Spring Boot. We will be talking about CustomizableTraceInterceptor, PerformanceMonitorInterceptor, and CommonsRequestLoggingFilter.
Using CustomizableTraceInterceptor
You can add CustomizableTraceInterceptor as a Bean and use that Bean as an advisor for what expressions you want to intercept. Basically, this interceptor allows us to intercept the method calls and add custom log messages.
To show this in the working example, we will be tracking repository timings. Firstly, create a class that will extend CustomizableTraceInterceptor as follows:
Likewise, I will explain in a bit what this class is doing. We need a @Bean that will use this interceptor to intercept repository methods. The code for this will look like below:
package com.abccompany.home.performance;

import org.springframework.aop.Advisor;
import org.springframework.aop.aspectj.AspectJExpressionPointcut;
import org.springframework.aop.support.DefaultPointcutAdvisor;
import org.springframework.context.annotation.Bean;
import org.springframework.context.annotation.Configuration;
import org.springframework.context.annotation.EnableAspectJAutoProxy;

@Configuration
@EnableAspectJAutoProxy(proxyTargetClass = true)
public class TraceLoggerConfig
{
    @Bean
    public RepositoryMethodInterceptor repositoryMethodInterceptor()
    {
        RepositoryMethodInterceptor repositoryMethodInterceptor = new RepositoryMethodInterceptor();
        repositoryMethodInterceptor.setHideProxyClassNames(true);
        repositoryMethodInterceptor.setUseDynamicLogger(false);
        repositoryMethodInterceptor.setExitMessage("Executed $[methodName] in $[invocationTime] " +
                "ms");
        return repositoryMethodInterceptor;
    }

    @Bean
    public Advisor advisor()
    {
        AspectJExpressionPointcut aspectJExpressionPointcut = new AspectJExpressionPointcut();
        aspectJExpressionPointcut.setExpression("execution(public * com.abccompany.home" +
                ".repositories.*Repository+.*(..))");
        return new DefaultPointcutAdvisor(aspectJExpressionPointcut, repositoryMethodInterceptor());
    }
}
Now if we look at this configuration, this is creating a bean for using RepositoryMethodInterceptor which is a subclass of CustomizableTraceInterceptor. You can see we have used an exit message to log the timing that the repository method took in this bean.
repositoryMethodInterceptor.setExitMessage("Executed $[methodName] in $[invocationTime] " + "ms");
AspectJExpression creates an expression for which the packages interception should happen. The class RepositoryMethodInterceptor does a few useful things. Firstly, it helps us to track the class information of Repository classes. Secondly, it logs the message in our log file. Once you run the application, you will see the log messages as below:
2020-05-24 19:08:04.870 INFO 14724 --- [nio-8443-exec-9] c.r.h.p.RepositoryMethodInterceptor : Entering method 'findUserByEmail' of class [com.abccompany.home.repositories.UserdataRepository] Hibernate: select userdata0_.id as id1_4_, userdata0_.email as email2_4_, userdata0_.firstname as firstnam3_4_, userdata0_.guid as guid4_4_, userdata0_.lastname as lastname5_4_, userdata0_.middlename as middlena6_4_, userdata0_.confirmpassword as confirmp7_4_, userdata0_.passwordtxt as password8_4_, userdata0_.phonenumber as phonenum9_4_, userdata0_.role as role10_4_ from userdata userdata0_ where userdata0_.email=?
2020-05-24 19:08:04.872 INFO 14724 --- [nio-8443-exec-9] c.r.h.p.RepositoryMethodInterceptor : Executed findUserByEmail in 2 ms
2020-05-24 19:08:04.872 INFO 14724 --- [nio-8443-exec-9] c.r.h.p.RepositoryMethodInterceptor : Entering method 'findAll' of class [com.abccompany.home.repositories.FeedbackRepository] Hibernate: select feedback0_.id as id1_1_, feedback0_.createdon as createdo2_1_, feedback0_.fromdate as fromdate3_1_, feedback0_.guid as guid4_1_, feedback0_.rating as rating5_1_, feedback0_.rentalpropertyid as rentalpr8_1_, feedback0_.review as review6_1_, feedback0_.todate as todate7_1_, feedback0_.userid as userid9_1_ from feedback feedback0_
2020-05-24 19:08:04.876 INFO 14724 --- [nio-8443-exec-9] c.r.h.p.RepositoryMethodInterceptor : Executed findAll in 4 ms
Using PerformanceMonitorInterceptor feature
So, in order to use PerformanceMonitorInterceptor , we will create a configuration class and add a bean that will create PerformanceMonitorInterceptor. AspectJExpressionPointcut will point to the expression that will evaluate our controller classes.
Like CustomizableTraceInterceptor, we will have a subclass that will extendPerformanceMonitoringInterceptor so we can log our messages in Spring Boot logging. This will look like below:
We will create a bean for ControllerMonitoringInterceptor . This bean will be part of our logger configuration which will also evaluate AspectJExpression for Controller classes. Therefore, it will look like below:
package com.abccompany.home.performance;

import org.aspectj.lang.annotation.Aspect;
import org.aspectj.lang.annotation.Pointcut;
import org.springframework.aop.Advisor;
import org.springframework.aop.aspectj.AspectJExpressionPointcut;
import org.springframework.aop.interceptor.PerformanceMonitorInterceptor;
import org.springframework.aop.support.DefaultPointcutAdvisor;
import org.springframework.context.annotation.Bean;
import org.springframework.context.annotation.Configuration;
import org.springframework.context.annotation.EnableAspectJAutoProxy;

@Configuration
@EnableAspectJAutoProxy
@Aspect
public class ControllerLoggerConfig
{
    @Pointcut("execution(* com.abccompany.home.controllers.*Controller+.*(..))")
    public void monitor()
    {

    }

    @Bean
    public ControllerMonitoringInterceptor controllerMonitoringInterceptor()
    {
        return new ControllerMonitoringInterceptor();
    }

    @Bean
    public Advisor advisorPerformance()
    {
        AspectJExpressionPointcut aspectJExpressionPointcut = new AspectJExpressionPointcut();
        aspectJExpressionPointcut.setExpression("com.abccompany.home.performance" +
                ".ControllerLoggerConfig.monitor()");
        return new DefaultPointcutAdvisor(aspectJExpressionPointcut,
                controllerMonitoringInterceptor());
    }
}
Now if we execute the application, the log messages will show latencies for Controller classes.
2020-05-24 20:12:09.237  INFO 9280 --- [nio-8443-exec-6] c.r.h.p.ControllerMonitoringInterceptor  : StopWatch 'com.abccompany.home.controllers.LoginController.signin': running time (millis) = 0
2020-05-24 20:12:18.263  INFO 9280 --- [nio-8443-exec-2] c.r.h.p.ControllerMonitoringInterceptor  : StopWatch 'com.abccompany.home.controllers.MainController.home': running time (millis) = 43
2020-05-24 20:12:20.025  INFO 9280 --- [nio-8443-exec-9] c.r.h.p.ControllerMonitoringInterceptor  : StopWatch 'com.abccompany.home.controllers.MainController.logout': running time (millis) = 12
2020-05-24 20:12:20.042  INFO 9280 --- [nio-8443-exec-5] c.r.h.p.ControllerMonitoringInterceptor  : StopWatch 'com.abccompany.home.controllers.LoginController.login': running time (millis) = 0
How to use CommonsRequestLoggingFilter
Additionally, Spring Boot offers one useful feature of logging incoming requests. This helps in monitoring the application and to see how the requests are coming. To use this feature, we will create a @Configuration class RequestLoggingFilter as below:
Once, we add this, we will see beforeRequest and afterRequest messages in the log as below:
2020-05-24 21:07:15.161  INFO 11984 --- [nio-8443-exec-1] gFilter$$EnhancerBySpringCGLIB$$cb4fdaab : Before request [uri=/css/bootstrap.min.css]
2020-05-24 21:07:15.171  INFO 11984 --- [nio-8443-exec-2] gFilter$$EnhancerBySpringCGLIB$$cb4fdaab : Before request [uri=/js/jquery.min.js]
2020-05-24 21:07:15.203  INFO 11984 --- [nio-8443-exec-7] gFilter$$EnhancerBySpringCGLIB$$cb4fdaab : Before request [uri=/js/bootstrap.min.js]
2020-05-24 21:07:15.290  INFO 11984 --- [nio-8443-exec-7] gFilter$$EnhancerBySpringCGLIB$$cb4fdaab : After request [uri=/js/bootstrap.min.js]
2020-05-24 21:07:15.306  INFO 11984 --- [nio-8443-exec-2] gFilter$$EnhancerBySpringCGLIB$$cb4fdaab : After request [uri=/js/jquery.min.js]
2020-05-24 21:07:15.318  INFO 11984 --- [nio-8443-exec-1] gFilter$$EnhancerBySpringCGLIB$$cb4fdaab : After request [uri=/css/bootstrap.min.css]
Conclusion
In conclusion, I showed three features for performance monitoring – CustomizableTraceInterceptor, PerformanceMonitorInterceptor, and CommonsRequestLoggingFilter to log useful performance metrics.
In this post, I will show how to resolve the error Spring context lookup failed. This scenario resembles if you are using Spring Boot 2.x or Spring Boot 1.5. I was recently using Spring Boot 2.x and ran into an error like below:
org.glassfish.jersey.server.spring.SpringComponentProvider: Spring context lookup failed,
skipping spring component provider initialization.
Why did I see this error?
Before I can explain why I saw this error. Let’s sort of some basic concepts about what ContextLoaderListner is and what DispatcherServlet is.
Spring boot creates multiple contexts. It will start with a root context and the rest of the contexts will be child contexts. Child contexts can access the beans defined in the root context, but not vice versa.
ContextLoaderListener
When you start the Spring Boot application, ContextLoaderListener creates the root application context. Spring boot will share this root context with all other child contexts that DispatcherServlet will create. Usually, you define ContextLoaderListener in web.xml like below:
ServletContext stores this root application context and one can use WebApplicationContextUtils to retrieve this context.
DispatcherServlet
DispatcherServlet is a HttpServlet whose primary purpose is to handle incoming web requests matching the configured URL pattern. When you define DispatcherServlet in Spring configuration, Spring will use a configured configuration file or creates its own configuration file based on controllers and views in the code.
DispatcherServlet creates one child application context per servlet entry.
Why Spring Context Lookup Failed:
Spring Boot 2.x offers a programmatic way to configure your contexts and servlets. In my particular case, I was using this programmatic way. But I had configured anyway to load application context, especially root application context.
To configure this root application context, I needed ContextLoaderListener . Since I didn’t want to use web.xml , I looked for a programmatic way. Spring boot 2.x offers this through SpringBootServletInitializer . Basically, when we extend the root application class with SpringBootServletInitializer, it binds Servlet, Filter, and ServletInitializer beans from the application context to the server. This also allows us to create a WAR archive of our application and run in any web container.
Once I added SpringBootServletInitializer in my main Spring Boot Application class, I was able to resolve this error. The code for that will look like below:
@SpringBootApplication
public class Application extends SpringBootServletInitializer
{
    public static void main(String[] args)
    {
        SpringApplication sa = new SpringApplication(Application.class);
        sa.run(args);
    }
}
Conclusion
In this post, we showed how we can resolve an error Spring Context Lookup Failed. If you have any feedback about this post, please comment and I will be happy to answer.
Consider the following scenario in which a docker container was throwing SSLHandshakeException. You are running a service in a docker container. This service calls another service in another docker container and the API calls fails with following error:
javax.net.ssl.SSLHandshakeException: sun.security.validator.ValidatorException: PKIX path building failed: sun.security.provider.certpath.SunCertPathBuilderException:
unable to find valid certification path to requested target
In this post, I will show how to resolve SSLHandshakeException within docker container with a simple fix.
Previously, I showed how to run your services using docker container in this post.
This scenario is very common with microservices running in docker containers. Also there are few ways you can resolve this issue, but I will suggest a standard way to resolve this issue.
Standard solution is to get SSL certificate of target service and import that certificate in keystore of Java runtime that calling service is using.
How do we resolve Docker Container – SSLHandshakeException?
The dilemma exists because every time you stop docker container and restart or kill a docker container and restart it, it will change container id. With that, you can’t be sure where JAVA_HOME of your calling service exists.
So depending on what Java environment are you using for your docker container, the easiest thing you can do is copy a cacerts keystore file from your local host machine to docker container when building the docker image.
Before you copy cacerts, make sure you import the SSL certificate of the target service. You can use keytool command to import this certificate.
This will build your docker image and will resolve the PKIX Path Building Failed error.
Drawback
A drawback of this solution is that you have to make sure that your base docker image has jvm path mentioned in the command. If it is different from above, you will have to first find that. Also if you call multiple services, you will have to get SSL certificates of all those servies.
One important thing to note that this should not happen in your production environment, but mostly development sandbox. Production environment should have CA signed SSL certificates on load balancer and all your services should be behind that load balancer while sharing the same certificate.
If your application is deployed in Heroku, Heroku server doesn’t provide email server by default. In my previous post Deploying application on Heroku, I showed how to deploy a Spring Boot application in Heroku. Over to that, most applications use their custom domain and you will need email addresses with those domains for support or sales perspective.
So how do you set up custom email with your application domain? In this case, I needed to set up an email address info AT rentersvoices.com so people could contact me.
It’s a straightforward process and I will show in this post how to set up custom email.
Set up Custom Email in Heroku Application
Remember Heroku offers an option of CloudMailIn for custom email. It helps to receive incoming emails. In this post, we will not be using CloudMailIn with the restriction it has for free option in Heroku.
Instead, we are using forwardemail.net. There are few other options available like MailGun or SendGrid
To set up a custom email, you will need to add CNAME or MX records for your domain with your domain provider.
In my case, I was using NameCheap as my domain provider.
Add following MX records for your domain:
Type      Host     Value             Priority   TTL
MX Record @     mx1.forwardemail.net  10       60 min

MX Record @     mx2.forwardemail.net  20       60 min
Once we have configured MX records, we will need to configure TX records. This step is required so we can forward email coming to our custom domain to an email address of our choice.
Type          Host           Value                                     TTL
TXT Record     @         forward-email=abc@yahoo.com                  60 min
TXT Record     @         v=spf1 mx include:spf.forwardemail.net -all  60 min
After we add these records, we should wait till the cache is cleared for the domain. You might have to wait for an hour at max. Now try sending an email to custom address (in this case info AT rentersvoices.com) and you will receive that email at abc AT yahoo.com.
Conclusion
In this post, we showed how to set up an email in Heroku application. If you have any feedback, please feel free to post your comments below.