Author Archives: yogesh.mali@gmail.com

How to file upload using Spring Boot

In this post, I will show how I added file upload functionality in my Spring Boot application, social KPI.

On the outskirts, it looks very simple functionality and it is indeed simple with Spring Boot. As part of this post, we will build a web form where an administrator will add additional users for his/her company by importing a CSV file in a particular format.

Basic functionality is to provide a way for an administrator to import a CSV file, read and validate the data, and save it in the database if proper data.

Now once we have defined our user story, let’s get started with the post.

Form For File Upload In a Spring Boot Application

We are using thymeleaf templates for our spring boot based application. So writing a simple html page with a form to upload a file is very straight forward as below:

<div class="container importuser">
    <div class="form-group">
    <form method="POST" th:action="@{/uploadUsers}" enctype="multipart/form-data">
        <input type="hidden" name="companyGuid" th:value="${companyGuid}"/>
        <input type="file" name="file"/></br></br>
        <button type="submit" class="btn btn-primary btn-lg" value="Import">Import
        </button>
    </form>
    </div>
</div>

As you see in this form, clicking on Import button will kick the action to upload users.

Controller to handle file upload on backend side

A controller to handle upload users functionality will look like below:

    @RequestMapping(value = "/uploadUsers",method= RequestMethod.POST)
    public String fileUpload (@RequestParam("file") MultipartFile file, @RequestParam(
            "companyGuid") String companyGuid,
                              RedirectAttributes redirectAttributes)
    {
        LOGGER.info("File is {}", file.getName());
        LOGGER.info("Company Guid is {}", companyGuid);

        if (file.isEmpty())
        {
            redirectAttributes.addFlashAttribute("message", "Please select a file to upload");
            return "redirect:/uploadStatus";
        }

        List userList = FileUtil.readAndValidateFile(file, roleRepository);
        for(User user: userList)
        {
            User createdUser = userManager.createUser(companyGuid, user);
        }

        redirectAttributes.addFlashAttribute("message",
                "You successfully uploaded " + file.getOriginalFilename() + " and added " + userList.size() + " users");


        return "redirect:/uploadStatus";
    }

The method to readAndValidateFile is simply reading the data from file, validating to make sure all the fields in CSV file exists, if wrong format, it will throw an error. If a valid file, it will create a list of users. UserManager will create each user.

The class FileUtil is as below:

package com.betterjavacode.socialpie.utils;

import com.betterjavacode.socialpie.models.Role;
import com.betterjavacode.socialpie.models.User;

import com.betterjavacode.socialpie.repositories.RoleRepository;
import org.springframework.beans.factory.annotation.Autowired;
import org.springframework.web.multipart.MultipartFile;

import java.io.BufferedReader;
import java.io.IOException;
import java.io.InputStream;
import java.io.InputStreamReader;
import java.util.ArrayList;
import java.util.List;

public class FileUtil
{
    private static final String FIRST_NAME = "firstname";
    private static final String LAST_NAME = "lastname";


    public static List readAndValidateFile (MultipartFile file, RoleRepository roleRepository)
    {
        BufferedReader bufferedReader;
        List result = new ArrayList<>();
        try
        {
            String line;
            InputStream inputStream = file.getInputStream();
            bufferedReader = new BufferedReader(new InputStreamReader(inputStream));
            while((line = bufferedReader.readLine()) != null)
            {
                String[] userData = line.split(",");
                if(userData == null || userData.length != 5)
                {
                    throw new RuntimeException("File data not in correct format");
                }
                if(FIRST_NAME.equalsIgnoreCase(userData[0]) && LAST_NAME.equalsIgnoreCase(userData[2]))
                {
                    continue; // first line is header
                }
                User user = new User();
                user.setFirstName(userData[0]);
                user.setMiddleName(userData[1]);
                user.setLastName(userData[2]);
                user.setEmail(userData[3]);
                Role role = roleRepository.findByRoleName(userData[4]);
                user.setRole(role);
                result.add(user);
            }
        }
        catch(IOException e)
        {
            throw new RuntimeException("Unable to open the file " + e.getMessage());
        }
        return result;
    }
}

A working demo

Once I log into the application Social KPI, I click on Add Users and it will take me to upload the users screen which will look below:
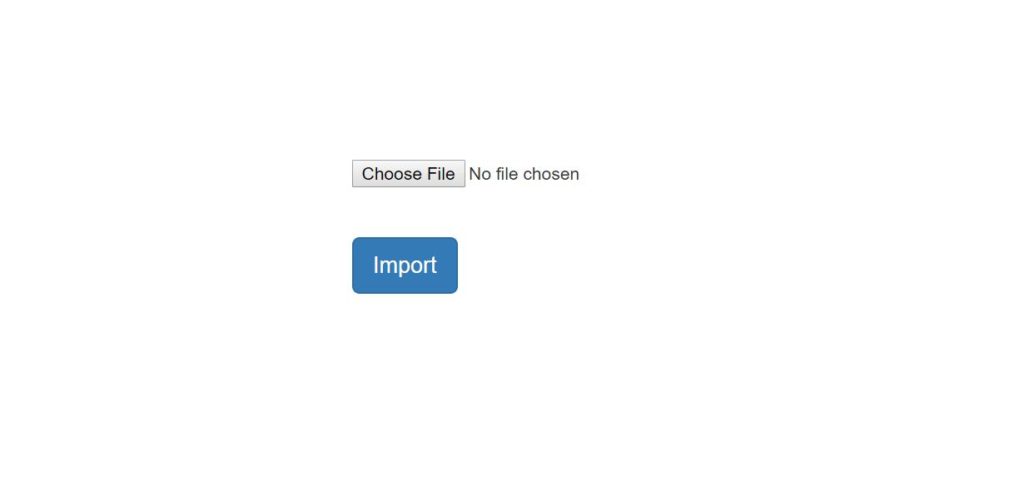
Spring Boot File Upload

Import Users

Once you choose a file in CSV format to upload and click on Import, it will show the screen as below:
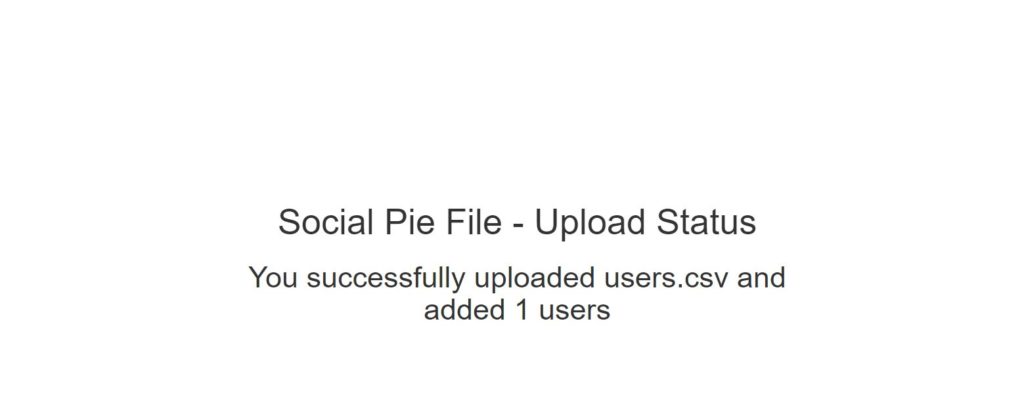
Spring Boot File Upload - Upload Status

File Upload Status

Conclusion

So in this post, we showed how to import a file while using Spring Boot multipart form.

References

  1. Uploading files – uploading files

Metrics collection with Micrometer and Prometheus

In my previous post here, I showed how to configure Micrometer and Prometheus to collect microservice performance metrics data. In this post, I will show how we can collect Spring Boot Actuator metrics data and transfer to Prometheus UI, and view it using dashboards.

Spring Boot offers a lot of great features with Actuator. With enterprise applications constantly looking for ways to monitor the application, these metrics become even more important.

Configure Prometheus using the docker

Firstly, we will configure the Prometheus. Depending on the environment you are using, start the docker terminal. Use the following command to download Prometheus

docker pull prom/prometheus

We will configure Prometheus to scrape metrics from our application’s actuator endpoint. As shown in the previous post here, spring boot actuator endpoint is running on http://localhost:8080/actuator/prometheus

We will add Prometheus configuration in prometheus.yml file as below:

# my global config
global:
  scrape_interval:     5s # Set the scrape interval to every 5 seconds. Default is every 1 minute.
  evaluation_interval: 5s # Evaluate rules every 5 seconds. The default is every 1 minute.
  # scrape_timeout is set to the global default (10s).
 
# Alertmanager configuration
alerting:
  alertmanagers:
  - static_configs:
    - targets:
      # - alertmanager:9093
 
# Load rules once and periodically evaluate them according to the global 'evaluation_interval'.
rule_files:
  # - "first_rules.yml"
  # - "second_rules.yml"
 
# A scrape configuration containing exactly one endpoint to scrape:
# Here it's Prometheus itself.
scrape_configs:
  # The job name is added as a label `job=<job_name>` to any timeseries scraped from this config.
  - job_name: 'prometheus'
 
    # metrics_path defaults to '/metrics'
    # scheme defaults to 'http'.
 
    static_configs:
    - targets: ['localhost:9090']
 
  - job_name: 'spring-actuator'
    metrics_path: '/actuator/prometheus'
    scrape_interval: 5s
    static_configs:
    - targets: ['IPADDRESS_OF_HOST:8080']

Few things to notice from this configuration file. scrape_interval is 5s. In scrape_configs , job name for our Spring Actuator endpoint is spring-actuator and the endpoint is running at /actuator/prometheus. The targets section shows where our application is running.  Save this file at a location that we can use to mount while running the docker container.

To Run the Prometheus using docker, use the following command:

docker run --name prometheus -d --mount type=bind,source=//c/Users/sandbox/prometheus.yml,destination=/etc/prometheus/prometheus.yml -p 9090:9090 prom/prometheus

This will start the Prometheus server at 9090 and it can be accessed at 9090.  Meanwhile, we can check the Prometheus dashboard. Let’s get the docker IP first by using the following command

docker-machine ip

Now check the Prometheus dashboard at http://docker-ip:9090 , it will look like below:

Spring Boot Actuator Metrics in Prometheus Dashboard

Conclusion

In this post, we showed how to run a Prometheus out of docker container and scrape metrics from Spring boot application.

References

  1. Spring Boot and Prometheus – Spring boot actuator and Prometheus
  2. Monitoring your microservices – Monitoring your microservices


Monitoring your microservice with Micrometer

Spring Boot has made building a web application way easier.  It has also added a lot of other critical libraries that help enterprise applications in different ways. With enterprise applications moving to the cloud, Spring Boot has made it easier to deploy spring applications in the cloud with continuous integration. In this post, I will show how we can use a spring micrometer library to gather analytics related to your code.

As a result, these analytics can be transferred to different vendor databases for creating metrics-based dashboards. I showed how to use spring-boot-actuator to collect some metrics data.

As Spring defines Micrometer is a dimensional-first metrics collection facade. In simple words, it is similar to SLF4J, except for metrics.

Configure Micrometer for microservice

Firstly to use a micrometer, I have created a simple microservice with REST APIs and it is built using Spring Boot 2. Most importantly Spring Boot has added backward compatibility for Spring 1.x.

You can configure Micrometer in your Spring Boot 2.X based Microservice by adding the following dependency in your build file

runtime('io.micrometer:micrometer-registry-prometheus:1.0.4')

Adding Metrics

We will discuss different metrics that we can add through the micrometer. Dimensions and names identify a meter. You can use Meter for different types of metrics.

Counter

Counters are a cumulative metric. These are mostly used to count the number of requests, number of errors, number of tasks completed.

Gauges

A gauge represents a single value that can go up and down. The gauge measures memory usage.

Timers

Timers measure the rate at which we call a particular code or method. Subsequently we can also find out latencies when the execution of code is complete.

We talked about different metrics and how we can configure micrometers. Now we will show how to use this library to configure against a monitoring system. Spring micrometer supports the number of the monitoring system. In this post, I will be showing how to use against Prometheus monitoring system.

What is Prometheus?

Prometheus is an in-memory dimensional time-series database with a built-in UI, a custom query language, and math operations. To know more, you can visit here.

Meanwhile, we can add Prometheus in our microservice by adding the following dependency in the Gradle file

compile('org.springframework.boot:spring-boot-starter-actuator:2.0.3.RELEASE')
runtime('io.micrometer:micrometer-registry-prometheus:1.0.4')

For example, to understand where Prometheus lies in whole architecture, look at the below

Spring Boot microservice -> Spring Micrometer -> Prometheus

Once the above dependencies are added, Spring boot will automatically configure PrometheusMeterRegistry and CollectorRegistry to collect and export metrics data in a suitable format that Prometheus can scrape.

To enable Prometheus endpoints

Similarly, you enable Prometheus and actuator endpoints. Add following properties in application.properties file

management.security.enabled = false
management.endpoints.web.exposure.include=health,info,prometheus

Now if we run to start our webserver to see how these endpoints look, we can verify by going to endpoints http://localhost:8080/actuator/info , http://localhost:8080/actuator/health and http://localhost:8080/actuator/prometheus .  Prometheus endpoint looks like below :

Prometheus

Conclusion

In this post, we showed how to use Spring Micrometer to capture metrics data and configure with Prometheus. In the next post, I will show how to display this data in the human-readable format in nice UI using Prometheus.

References

  1. Production-Ready Metrics – Metrics
  2. Spring Micrometer – Spring Micrometer


Introduction to Graphs

In my previous article, I talked about hashtables. I will discuss one more data structure in this post and it is probably one of the most important data structures of all and that is Graphs.

Clearly, our current web technologies are heavily reliant on graphs. Google, Facebook, or LinkedIn or any social media platform which includes users use graphs as a data structure. So, graphs are the most common data structure to solve problems related to finding the distance between two nodes OR the shortest path from place A to place B.

Therefore, when it comes to the social network, we are accustomed to six degrees of freedom, in such cases, we can use graphs to find how many degrees will it take to connect two nodes on the social network. In networking, most use graphs to find the fastest way to deliver the response.

How do you explain Graphs to 5-year-olds?

The easiest example, one can give to a kid to explain Graphs, is to look at City A and City B on a map. Now use the road that connects to those two cities.

City A – has bananas, and oranges, city B – has apples, and city C – has watermelons.

Now on the map, when we travel from City A to City B, what possible route we can take and what information we can exchange. City A and City B can transfer apples, bananas, oranges to each other. Once City B gets bananas and oranges, it can transfer that to other neighboring cities.

In short, we are connecting nodes (vertices) of cities A and B through a road (edge) while exchanging the products these two cities are known for.

Graphs Data Structure

In this post, we will discuss graphs from the Java perspective. Graphs allow representing real-life relationships between different types of data. There are two important aspects to graph:

  • Vertices (Nodes) – Nodes represent the points of a graph where the graph is connected. Node store the data or data points. 
  • Edges – Edges represent the relationship between different nodes. Edges can have weight or cost.

However, there is no starting node or ending node in the graph. A graph can be cyclical or acyclical. In conclusion, edges can be directed or undirected which give birth to graphs as directed or undirected. 

For instance, edges are generally represented in the form of a set of ordered pairs as in (x,y) – there is an edge from node x to node y. So (x,y) can be different from (y,x), especially in the directed graph.

Representations of Graphs

A. Adjacency Matrix –

This is a 2 dimensional array of size n*n where n is number of nodes in the graph. adj[][] is the usual way of representing this matrix.  So if adj[i][j] = 1, it represents an edge between node i and node j. Adjacency matrix for an undirected graph is symmetrical. Now if I have to represent the graph shown above in the figure, I will represent it like below:

                A               B             C        G         E
               A                 0               1             0         1         0
               B                1              0             1         0         1
               C                0              1             0         0         1
               G                1              0             0         0         1
               E                0              1             1         1         0

 B. Adjacency List –

Similarly, an array of lists is used. The size of the array is equal to the number of nodes in the graph. So arr[i] will indicate the list of vertices adjacent to node i.


Operations on the Graphs

There are common operations that we will use often. Likewise, graph as a data structure offers the following operations:

Additions

addNode  – Add a node in the existing graph

addEdge – Add an edge in the existing graph between two nodes

Removal

removeNode – Remove a node from the existing graph

removeEdge – Remove an edge between two nodes from the graph

Search

contains– find if the graph contains the given node

hasEdge – find if there is an edge between given two nodes


Time and Space Complexity of operations on Graphs

Above all, a post would be incomplete if I didn’t talk about complexity about operations on the graph data structure. Basically, this really depends on what representations you use for the graph. With adjacency matrix, addition and removal operations are O(1) operations. While search operations like contains and hasEdge are also O(1) operations. In addition, the space complexity for the adjacency matrix is O(n*n).

While with adjacency list, additions are O(1) and removal of a node is O(n) operation, removal of an edge is O(1) . Therefore, search operations are equally O(1)

Conclusion

In conclusion, I showed the basics of the graph as a data structure. The graph is a data structure that contains nodes and edges. Also, It has operations like additions, removal, and search. In future posts, I will talk about implementing Depth First Search and Breadth First Search in the graph. After that, we will solve some real problems using this data structure. Above all, Graph is an important data structure.

References

  1. Introduction to Graphs – Graphs
  2. Graph as data structure – Graph as data structure

Hash Tables

What are Hash Tables?

Hash Tables are data structures used to store the data in key/value pair format. It uses a hash function to compute an index which will be used in an array to store the element at that index.

What is key/value pair though?

Alright, I will be digging in fundamentals here. Let’s take an example of database table. To retrieve a particular value from database table, you sometimes need to know a primary key or a unique value from the row of database table. Then you query on database table based on that unique value or primary key to get that entire row or that particular value you are looking for me.

Still complicated?

Let’s take an example of classroom. You are in 2nd grade class and when a teacher does roll call, she doesn’t necessarily call your name, she calls the number assigned to you. So example

1 – John Doe

2 – Jill Doe

3 – Mark Ranson

So the roll number assigned to the student becomes a key to identify that student.

Similarly in programming languages (Java in this case), we use a data structure called Hash Tables.

Hash function takes an input, hashes that input to generate an index which we use as a key to store the value in an array. Why so complexity? Why not we go in sequential order?

There are many reasons, first hashing gives security. If somebody exploits sequential order, it is easy to find next element. But hashing allows us to randomly store the data. But the most important, the average time required to search for an element in a hash table is O(1).

Now from the basics, we can say that hash tables have two components – one an array to store the value and a function to calculate the index of the array.

So what is a hash function and how do we write this hash function?

A hash function is a function that takes a data of any size and transforms that data into a fixed size data. In short a hash function will take an input x and transform that into output y. Now, this looks simple, but the question arises what if there are multiple inputs that can be transformed into y. Then we will have a problem. This is known as Collision.

Important characteristics of this hash function

  1. It should avoid collision.
  2. It should easily calculate the keys.
  3. It should uniformly distribute the keys.

How to avoid collision?

There are a couple of techniques.

One technique is open addressing. In Open Addressing, store all elements in hash table itself. At any point, the size of the hash table must be greater than or equal to that of the number of keys. This is useful in the scenario of fixed size tables. During insertion, if you found the occupied slot in the hash table, you go for the next slot. It will continue until it finds an unoccupied slot. Since this is a linear process, open addressing is also linear probing. The disadvantage of open addressing is insertion and search operation becomes linear.

The second technique is Separate Chaining. In this, make each cell of a hash table point to a linked list of records. So if a hash function returns a duplicate key, the value will be placed in a linked list which will be pointed by earlier value stored at that key. The next value will be pointed by earlier linked list element. To make this simpler – let’s assume we have a has function key % 3 and so for 9, it will return 0. For 10, it will return 1. For 16, it will return 1 again. Now when we will store a value (for 10), we will store at index 1 and the next value (for 16), will be in a linked list pointed by the value stored at 1.

When do we use hash tables?

  1. Hash tables offer fast insertion
  2. Hash tables allow fast deletion
  3. Hash tables can help in searching an element

References

  1. Hash tables as data structures
  2. Hash Tables