Tag Archives: Prometheus

Metrics collection with Micrometer and Prometheus

In my previous post here, I showed how to configure Micrometer and Prometheus to collect microservice performance metrics data. In this post, I will show how we can collect Spring Boot Actuator metrics data and transfer to Prometheus UI, and view it using dashboards.

Spring Boot offers a lot of great features with Actuator. With enterprise applications constantly looking for ways to monitor the application, these metrics become even more important.

Configure Prometheus using the docker

Firstly, we will configure the Prometheus. Depending on the environment you are using, start the docker terminal. Use the following command to download Prometheus

docker pull prom/prometheus

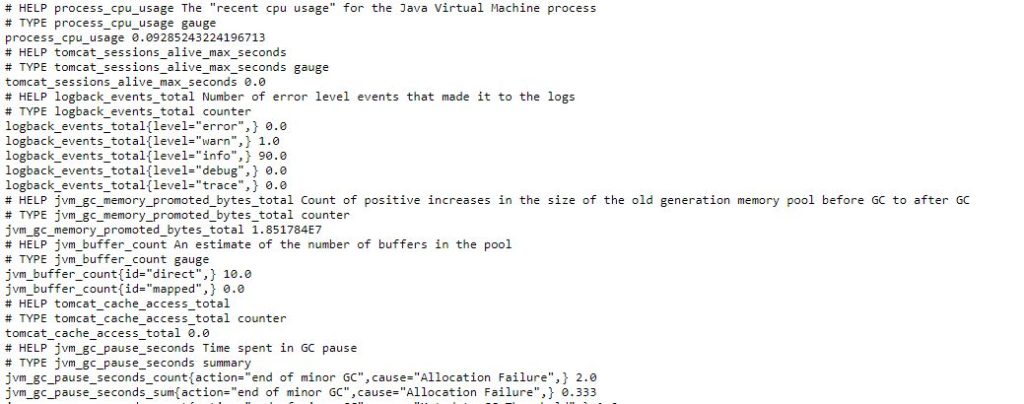
We will configure Prometheus to scrape metrics from our application’s actuator endpoint. As shown in the previous post here, spring boot actuator endpoint is running on http://localhost:8080/actuator/prometheus

We will add Prometheus configuration in prometheus.yml file as below:

# my global config
global:
  scrape_interval:     5s # Set the scrape interval to every 5 seconds. Default is every 1 minute.
  evaluation_interval: 5s # Evaluate rules every 5 seconds. The default is every 1 minute.
  # scrape_timeout is set to the global default (10s).
 
# Alertmanager configuration
alerting:
  alertmanagers:
  - static_configs:
    - targets:
      # - alertmanager:9093
 
# Load rules once and periodically evaluate them according to the global 'evaluation_interval'.
rule_files:
  # - "first_rules.yml"
  # - "second_rules.yml"
 
# A scrape configuration containing exactly one endpoint to scrape:
# Here it's Prometheus itself.
scrape_configs:
  # The job name is added as a label `job=<job_name>` to any timeseries scraped from this config.
  - job_name: 'prometheus'
 
    # metrics_path defaults to '/metrics'
    # scheme defaults to 'http'.
 
    static_configs:
    - targets: ['localhost:9090']
 
  - job_name: 'spring-actuator'
    metrics_path: '/actuator/prometheus'
    scrape_interval: 5s
    static_configs:
    - targets: ['IPADDRESS_OF_HOST:8080']

Few things to notice from this configuration file. scrape_interval is 5s. In scrape_configs , job name for our Spring Actuator endpoint is spring-actuator and the endpoint is running at /actuator/prometheus. The targets section shows where our application is running.  Save this file at a location that we can use to mount while running the docker container.

To Run the Prometheus using docker, use the following command:

docker run --name prometheus -d --mount type=bind,source=//c/Users/sandbox/prometheus.yml,destination=/etc/prometheus/prometheus.yml -p 9090:9090 prom/prometheus

This will start the Prometheus server at 9090 and it can be accessed at 9090.  Meanwhile, we can check the Prometheus dashboard. Let’s get the docker IP first by using the following command

docker-machine ip

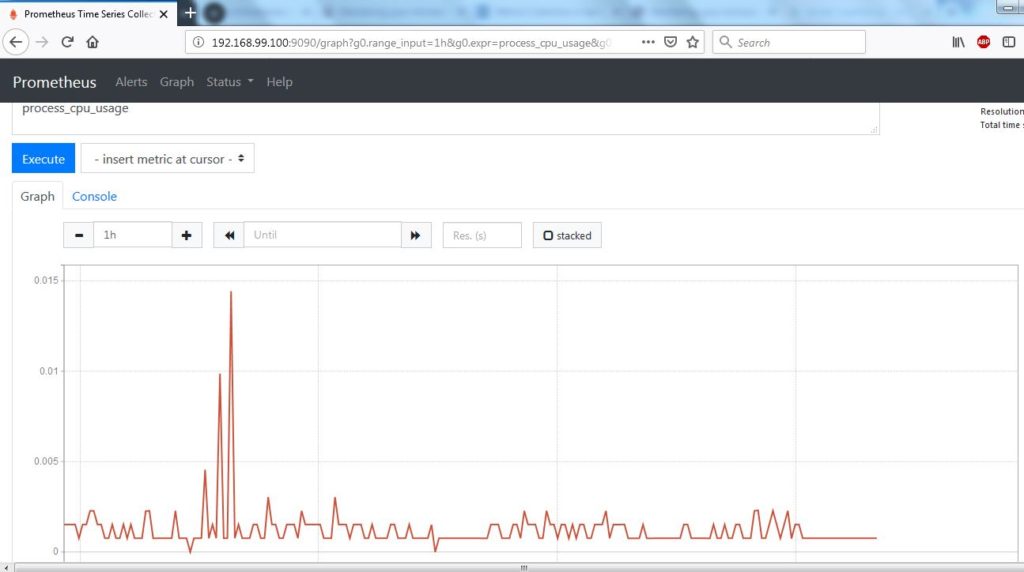
Now check the Prometheus dashboard at http://docker-ip:9090 , it will look like below:

Spring Boot Actuator Metrics in Prometheus Dashboard

Conclusion

In this post, we showed how to run a Prometheus out of docker container and scrape metrics from Spring boot application.

References

  1. Spring Boot and Prometheus – Spring boot actuator and Prometheus
  2. Monitoring your microservices – Monitoring your microservices


Monitoring your microservice with Micrometer

Spring Boot has made building a web application way easier.  It has also added a lot of other critical libraries that help enterprise applications in different ways. With enterprise applications moving to the cloud, Spring Boot has made it easier to deploy spring applications in the cloud with continuous integration. In this post, I will show how we can use a spring micrometer library to gather analytics related to your code.

As a result, these analytics can be transferred to different vendor databases for creating metrics-based dashboards. I showed how to use spring-boot-actuator to collect some metrics data.

As Spring defines Micrometer is a dimensional-first metrics collection facade. In simple words, it is similar to SLF4J, except for metrics.

Configure Micrometer for microservice

Firstly to use a micrometer, I have created a simple microservice with REST APIs and it is built using Spring Boot 2. Most importantly Spring Boot has added backward compatibility for Spring 1.x.

You can configure Micrometer in your Spring Boot 2.X based Microservice by adding the following dependency in your build file

runtime('io.micrometer:micrometer-registry-prometheus:1.0.4')

Adding Metrics

We will discuss different metrics that we can add through the micrometer. Dimensions and names identify a meter. You can use Meter for different types of metrics.

Counter

Counters are a cumulative metric. These are mostly used to count the number of requests, number of errors, number of tasks completed.

Gauges

A gauge represents a single value that can go up and down. The gauge measures memory usage.

Timers

Timers measure the rate at which we call a particular code or method. Subsequently we can also find out latencies when the execution of code is complete.

We talked about different metrics and how we can configure micrometers. Now we will show how to use this library to configure against a monitoring system. Spring micrometer supports the number of the monitoring system. In this post, I will be showing how to use against Prometheus monitoring system.

What is Prometheus?

Prometheus is an in-memory dimensional time-series database with a built-in UI, a custom query language, and math operations. To know more, you can visit here.

Meanwhile, we can add Prometheus in our microservice by adding the following dependency in the Gradle file

compile('org.springframework.boot:spring-boot-starter-actuator:2.0.3.RELEASE')
runtime('io.micrometer:micrometer-registry-prometheus:1.0.4')

For example, to understand where Prometheus lies in whole architecture, look at the below

Spring Boot microservice -> Spring Micrometer -> Prometheus

Once the above dependencies are added, Spring boot will automatically configure PrometheusMeterRegistry and CollectorRegistry to collect and export metrics data in a suitable format that Prometheus can scrape.

To enable Prometheus endpoints

Similarly, you enable Prometheus and actuator endpoints. Add following properties in application.properties file

management.security.enabled = false
management.endpoints.web.exposure.include=health,info,prometheus

Now if we run to start our webserver to see how these endpoints look, we can verify by going to endpoints http://localhost:8080/actuator/info , http://localhost:8080/actuator/health and http://localhost:8080/actuator/prometheus .  Prometheus endpoint looks like below :

Prometheus

Conclusion

In this post, we showed how to use Spring Micrometer to capture metrics data and configure with Prometheus. In the next post, I will show how to display this data in the human-readable format in nice UI using Prometheus.

References

  1. Production-Ready Metrics – Metrics
  2. Spring Micrometer – Spring Micrometer