Author Archives: yogesh.mali@gmail.com

How to use JProfiler for Performance testing

If you are a developer, some point of time you will have to use JProfiler for measuring the performance of your application. Many times, this is left to specialized performance teams or developers who know the tools well, but don’t know much about the code that they are trying to measure the performance. This approach, despite might be working, can have its flaws. Especially since performance team members are not writing the code. So as part of this past, I want to debunk few myths around this and why a developer should equally focus on a tool like JProfiler to check the performance.

What will you need

  • JProfiler (standalone or plugin in IntelliJ)
  • IntelliJ
  • A web application that you can profile

Understanding JProfiler

First JProfiler is a tool to understand what is going on inside a running JVM. Before we run the test, we should understand the basic functionality of JProfiler and how it will help us in performance improvement.

There are three aspects to JProfiler:

Time Profiling – This measures the execution paths of your application on the method level.

Memory Profiling – This provides the in-depth understand of heap usage by the application.

Thread Profiling – This analyses the thread synchronization issues.

JProfiler combines time, memory and thread profilers in a single application.

Performance Test

In this test, we will be profiling java code of the application. You can download JProfiler as a standalone tool to run or download a plugin with IntelliJ which is what I have done in my case.

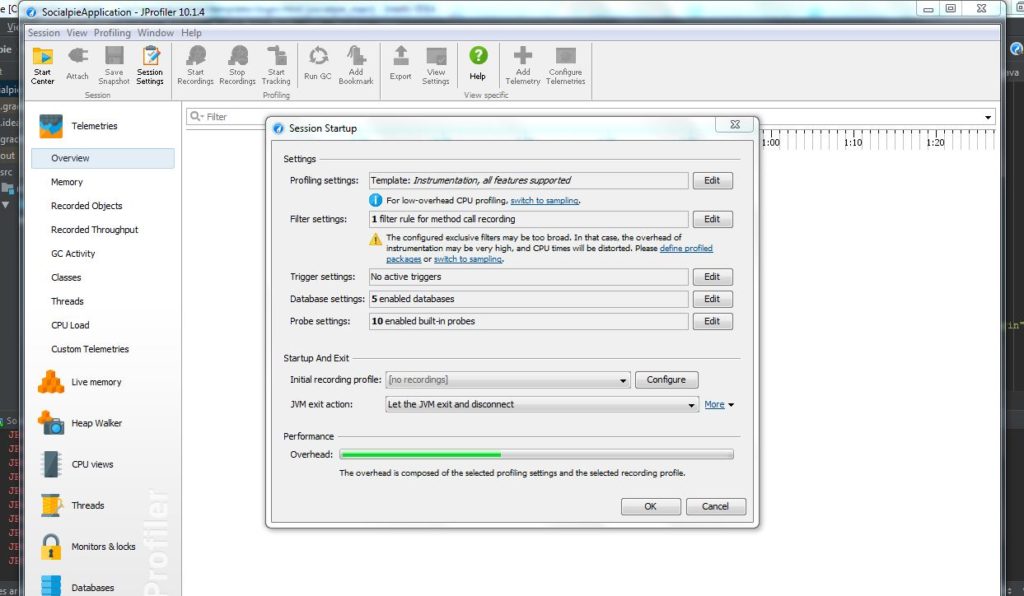
Once you start IntelliJ for your web application either locally or remotely, you will see an icon on top right to start the JProfiler. If you are running the application locally, JProfiler will launch and will ask user to find the directory where JProfiler.exe is located, once you click OK, it will start the application server (from intelliJ RUN configuration).

JProfiler from IntelliJ

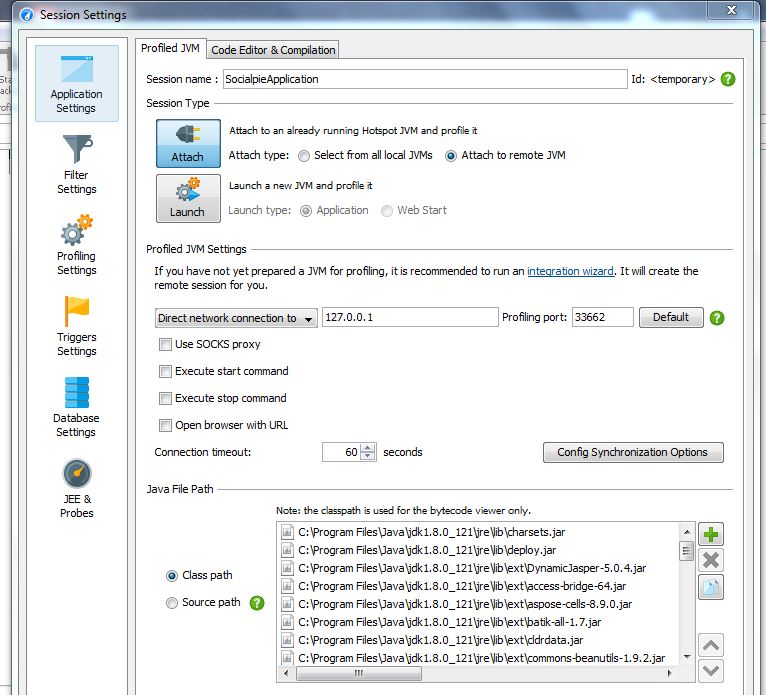
In Filter Settings , you can select the option Edit and it will launch another window where you can provide other application related settings. You can also run JProfiler for a remote application. For that you can provide the application’s host and port address in this application settings.

Application Settings

In my case, I am running the application locally, so I will skip these settings for right now.

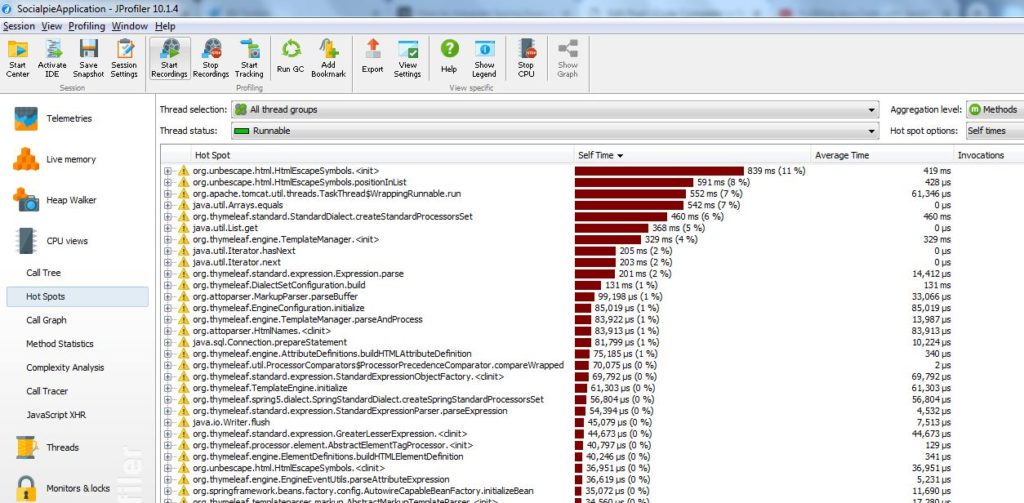
Once the OK button is clicked, it will launch the tomcat webserver that I am using in this Spring based web application. I will launch my application in another browser window and do the necessary testing with application. JProfiler should profile my activity. Once you do that, we can verify CPU view for hot spots that Profiler found in our application. This will look like below:

Hot Spots

One good thing about this feature is that it shows where the application is taking more time and it is arranged in descending order. So most of the time that my code is taking in the libraries that I am using. If you expand each node, you will find in detail about each method that is getting called.

Conclusion

In this post, I showed how to use JProfiler. This was an introductory post as I have not talked about the different views that JProfiler offers for profiling the application.

Migrate Android Project from Eclipse to Android Studio

I remember downloading Android Studio back in 2013 to work on an Android project. But after playing around for an hour or two, I got frustrated. I had to delete Android Studio and go back to Eclipse. One reason why Eclipse was never successful with android because of patchy user interface for building Android applications, unfortunately that’s still the case in 2018.

Well, at least Google has made significant changes with Android Studio from 2015. It is almost compulsory to use Android Studio to build any new android applications. But there are few eclipse devotes like me who were still using eclipse to build android applications.

In this post, I will show how to migrate an android project from Eclipse to Android Studio. Warning: Even though the post looks very simple, it took me sizable efforts to figure out this migration. Hope it will be easier for readers.

Steps to migrate from Eclipse to Android Studio

  1. Download Android Studio from here. I had downloaded Android Studio version 3.3 RC2, but for it kept giving me syncing error when I imported the project. So I downgraded Android Studio version 3.2.1. Install Android Studio on your environment.
  2. On starting screen of Android Studio, you will see an option to import existing ADT project. Here you choose your eclipse based android project.
    1. Other option in this scenario, is to export android project from eclipse as gradle based project and it will also make life easier to import that project in Android Studio.
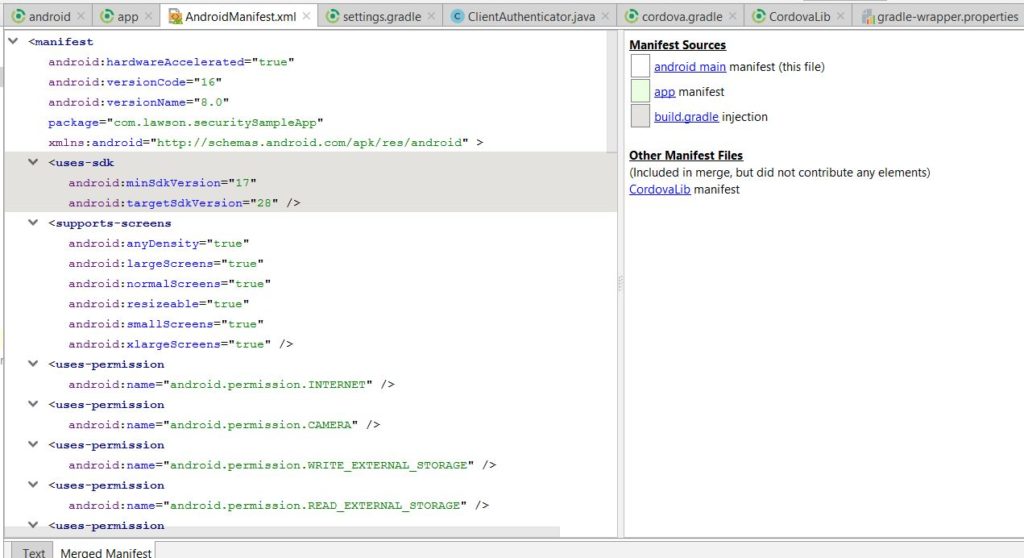
  3. Once you import the project in Android Studio, it will take some time to sync. In sync, Android Studio is basically creating gradle build file for your project. Converting all your library jars into dependencies. Other task it will be doing is to merge all your AndroidManifest.xml files. If there are any errors, it will show those errors during sync. Easiest way to fix AndroidManifest.xml errors are to go to this screen:

 4. Once the sync is successful, you can still face some issue to build the project. One major change with android studio gradle build is that in dependencies compile has been replaced by implementation project OR implementation files. Also to pull most of your dependencies, you will have to add google() as maven URL. minSdkVersion and targetSdkVersion should be moved to build file now and you can remove that from AndroidManifest.xml . Most of this should let you build your project successfully.

Conclusion

In this post, I showed how to migrate from eclipse to android studio for your android project. It is straight forward, but definitely depending on the project, you will run into few issues that you will have to resolve while building the project. Send me email or comment on this post if you have any questions.


Supporting FORMS authentication for ADFS in Android applications

Scenario with ADFS Authentication

Recently I came across this scenario where an application was using ADFS for authentication. The administrator had configured Windows Integrated Authentication as well as Forms Authentication as authentication policies. But when the user accessed the Android application, passive authentication through the Android webview browser fails because it redirects to the Windows Integrated Authentication URL instead of Forms Authentication. As the webview browser does not support WIA.

Android Phone

A solution to configure ADFS

Most organizations when using Active  Directory Federation Services (ADFS), use windows integrated authentication for their intranet. This helps users in their networks to enter credentials only once. Most browser-based applications provide a seamless experience to users without asking them to enter credentials again.

However, in this scenario, a user was trying to access an android application that equally needs passive authentication with an android webview browser. But android webview browser does not support WIA that results in authentication failure.

In such a scenario, ADFS should fall back to FORMS authentication and redirect the user to the login form. ADFS for windows server provides a simple configuration trick for authentication to fall back to FORMS.

  1. WIASupportedUserAgentString property of Set-ADFSProperties command
  2. WindowsIntegratedFallbackEnabled property of Set-AdfsGlobalAuthenticationPolicy command

Set-AdfsGlobalAuthenticationPolicy -WindowsIntegratedFallbackEnabled $true

WIASupportedUserAgentString gives the user agents that support WIA. If the component of the user agent string does not match any of the components of the user agent strings that are configured in WIASupportedUserAgentString property, ADFS will fall back to providing forms-based authentication, provided WindowsIntegratedFallbackEnabled flag is set to true.

Get-AdfsProperties | Select -ExpandProperty WIASupportedUserAgents

MSIE 6.0

MSIE 7.0; Windows NT

MSIE 8.0

MSIE 9.0

MSIE 10.0; Windows NT 6

MSIE 11.0; Windows NT 10

Windows NT 6.3; Trident/7.0

Windows NT 6.3; Win64; x64; Trident/7.0

Windows NT 6.3; WOW64; Trident/7.0

Windows NT 6.2; Trident/7.0

Windows NT 6.2; Win64; x64; Trident/7.0

Windows NT 6.2; WOW64; Trident/7.0

Windows NT 6.1; Trident/7.0

Windows NT 6.1; Win64; x64; Trident/7.0

Windows NT 6.1; WOW64; Trident/7.0

Windows NT 10.0; Trident/7.0

Windows NT 10.0; Win64; x64; Trident/7.0

Windows NT 10.0; WOW64; Trident/7.0

MSIPC

In this particular case, we removed Safari and Chrome from the list of user-agent strings, that’s when the authentication for application worked through passive authentication.

Conclusion

In conclusion, I showed in this post how to use FORMS authentication with ADFS for an android application. If you enjoyed this post, subscribe to my blog.

References

  1. Configuring Forms based authentication
  2. Forms based authentication


How to use JMeter for load testing

Any enterprise application has to perform well under load. So performance of such application can be tracked. There are tools that help to track this performance. Apache JMeter is one such tool. In this post, we will use Apache JMeter to do a load test on a sample application and see how we can measure the performance.

Depending on your application, you can track different functionality for load tests. Database heavy operations would be the most affected by this tracking. That’s where load tests can help us to point out flaws in our design and code and how we can improve. One major difference to note is that load tests are different from stress tests. In stress tests, we try to measure how much load the application can tolerate before it breaks. In load tests, we are measuring the performance from a time perspective.

What you will need

  • Apache JMeter
  • A running web application
  • Browser of your choice

Load Test Process

Start Apache JMeter and record the test script. Let’s create a test plan that we will execute for our load test. As part of this post, I will be load testing login to a Spring boot based web application that I am running at https://localhost:8443/home

Create a test plan

Once you launch JMeter, on left hand side window you will see an option for test plan. Create a test plan and let’s name it Test1 as shown below:

Test Plan for JMeter Script

Once you create the test plan, select how many threads (number of users) you want to run for this test, what’s the ramp-up period for one thread and what’s the loop count. For this post, I have selected 50 threads with each thread ramping up in 2 seconds with a single loop.

Add Config Elements

Right click on test plan and add config elements for HTTP Cache Manager and HTTP Cookie Manager.  This is required for handling CSRF tokens in our request that we will need later.

Add a Sampler

Now to test our web application, we will add a sampler with HTTP Request. We will name this HomePage. This is displayed as below:

Http Request Sampler

We will have to provide protocol, server name, port number and path as shown above.

Add a Listener

Now we will add a listener to our sampler to view results as a tree.

Add a Post Processor

We will need _csrf token from our home page so we can pass this token in POST request to login page of web application.

This Post Processor will have a regular expression extractor which will extract _csrf token from home page and will pass to next HTTP Request Sampler for Login Page.

Regular Expression Extractor

Add another Sampler for Login Page

Now we will add Sampler for Login Page which will be a POST request to login endpoint of our web application. We will also pass username and password along with _csrf token whose value will be populated from extractor.

Login Page

Run the test script for load test

Now if we run our script in JMeter, it will run 50 threads at the same time to test login for application. Depending on performance, it might take a long time, but considering this a simple application, JMeter will run this test within few seconds.

Review the results

Once the test is complete, you can check the View Results Tree  and it will show you the results of our each individual test thread. In Response Data tab, you can view if our test was successful or not. It should show the result of our page in html format.

Results

Conclusion

In this post, we used Apache JMeter for load testing and how it can help us to design our application from performance perspective.

References

  1. JMeter with Blazemeter
  2. Load Testing using JMeter

Could not find or load main class org.apache.maven.surefire.booter.ForkedBooter

Problem with Surefire library

Recently one of my Jenkins build failed with an error Could not find or load main class org.apache.maven.surefire.booter.ForkedBooter . A surefire plugin that maven was using to run JUnit tests was failing.

surefire library issue

A solution to fix the issue with Surefire library

I found two solutions to this problem. But first, let’s try to understand what exactly caused this problem.

In OpenJDK version 1.8.181, there were some behavioral changes that might be the reason for this issue. I had updated the Java version to use based on the system in my Jenkins build. This will make a system to get the latest open JDK. Also, there is a bug in the surefire plugin that is using absolute paths while Java will allow only relative paths. You can find more details about this issue here.

So to fix this issue, the easiest solution is Djdk.net.URLClassPath.disableClassPathURLCheck=true .

Another solution that worked for me was to go back to the older JDK version that I was using in Jenkins build before I shifted to System option. I went back to open JDK version 1.8.118 version and it did the trick also.

Conclusion

In conclusion, I showed how to fix an error during Jenkins build “Could not find or load main class”. If you enjoyed this post, subscribe to my blog here.

References

  1. Could not find forkedbooter class – here
  2. Surefire bug