Category Archives: Programming

Microservice Example Event Source Architecture

In this post, we will build a simple microservice using an Event Source architecture pattern. Previously, I discussed Event-Driven architecture. This post will be more elaborative on how one can build a microservice with this pattern. But before we do that, let’s look at some fundamentals.

Event Sourcing

Event sourcing is an append-only log of events. We store the events and also the context of those events. Every service will store the data as events.

Usually, the data is related to changes to the business/domain entity. Every change is captured as an event. The service stores the event in a database with all the required context. This allows rebuilding of the current state of the entity.

Auditing is one of the benefits of event sourcing. The key difference between audit logs and event sourcing is the context. In audit logs, there is no context of changes to entities. But, with event sourcing, context is part of the storage.

Event Store

Event Store is an event database. A system records each change to the domain in the database. Event store stores immutable events. Events are by nature immutable. We can rebuild the entity state using the event store.

To give an example – consider if you swipe a debit card to buy something and the money from your bank account is deducted.

In this scenario, a system will trigger an event CardSwiped. We will store the event CardSwiped with details like date, price, and merchant details. For any reason, if the transaction has to be reversed, the system will send another event instead of changing anything with the first event. Reversing of a transaction is itself an event. So, it will trigger CardTransactionReverse event.

In short, we did not change CardSwiped as an event in the database, but we changed the effect it caused.

Streams

Within the event store, the events for a domain live in an event stream. One can rebuild the state of the domain by reading all the events from a stream.

As the name goes, streams are incoming events. The sequence of events matters, especially if the state of the domain is going to change. A unique number or numeric value represents the position of the event.

Benefits of Event Sourcing

There are a number of benefits of using event sourcing. Here goes the list

  • Auditing
  • Asynchronous communication
  • Fault tolerance
  • Easier to rebuild the state
  • Observability
  • Service autonomy – If a service with event sourcing is down, dependent services can catch up when the service is back.

Microservice Example

In this example, we will look at when a customer orders for food delivery.

  1. Customer orders for food. Order service takes up the order and runs some validation before creating order.
  2. Order service will call Consumer service to verify consumer details.
  3. Order service will call Kitchen service to create food order ticket.
  4. Order service will call Accounts service for credit card authorization.
  5. If everything went successfully, order service will create an order.

For demo purposes, we won’t detail each piece of this example. I will show how an order service will create an order.

In event sourcing, each event is a domain event. To understand domain event better, you should check domain-driven design.

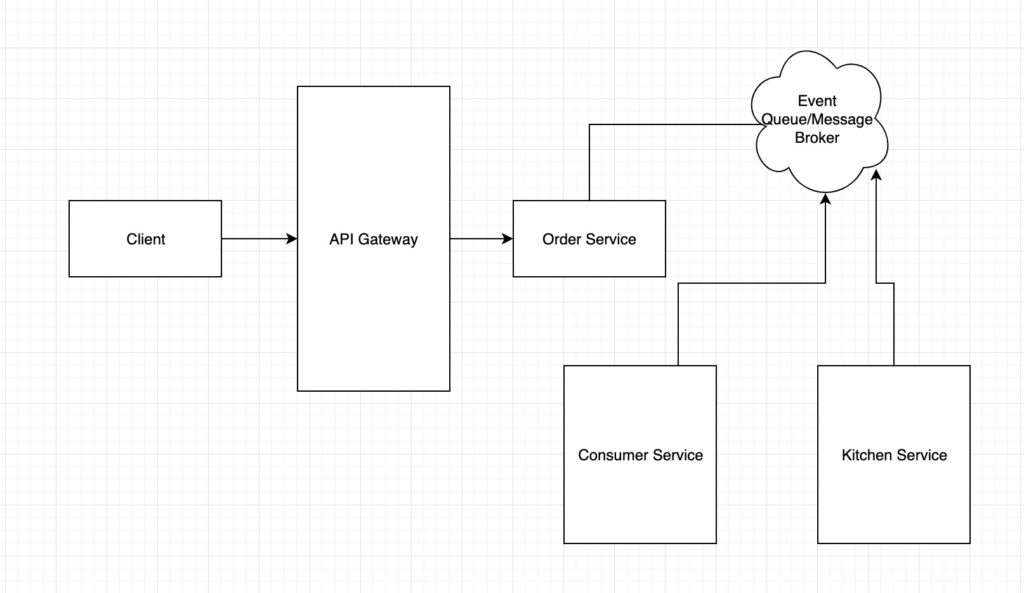
event source architecture - order service

Domain Event

In event sourcing, we represent domain entity or aggregate with domain event. The usual approach to name an event is to use past-participle verb. Example – OrderCreated CreditCardAuthorized.

These domain events include information about the domain. It represents the state changes for the domain entity. It also includes Event id, timestamp, user information.

In our microservice example, we will be using number of domain events – OrderCreated, CreditCardAuthorized, OrderRejected, OrderShipped.

Whenever a consumer places an order to buy food, either the client will send a request for order. For managing orders, we have a microservice OrderService. OrderService can store the incoming order request as is in database. OrderService will need to inform KitchenService about the order, so it can prepare the food. In mean time, if we receive some update to original order, it will overwrite the details of initial order. We lose important state changes.

Now, comes the event sourcing.

With event sourcing, we can create domain events and these events track the state of domain. When a client sends initial request, the event OrderCreated tracks the order creation. Before order is getting ready for KitchenService , if a customer updates or cancels the order, we will have OrderUpdated OR OrderCanceled events.

We store each of these events in event store. Event store allows to create object by applying those events.

In many instances, aggregates can be tightly coupled. To avoid the tight coupling, each aggregate can publish a domain event while storing the event data in its store. This store acts as audit log as well as provides a capability to rebuild the state.

Order service will then publish the event OrderCreated through message broker. Various services like Kitchen service and Accounts Service will subscribe to the event. They will perform their work asynchronously. Kitchen service will then perform consumer verification and if successful, it will send ConsumerVerified event. Accounts Service will equally create CreditCardAtuhorized.

CQRS Pattern

When using event sourcing as architecture pattern, you will also use CQRS (command query responsibility segregation) pattern.

In traditional database application, we use CRUD operations to manage data. CQRS conceptually separates the model for update and display. Command acts for create, update and delete and Query acts for fetching the data from database.

In our example for Order Service, when a user orders for food delivery, client sends a request. We use request details to call command CreateOrder . Order repository uses this command to save order details. And then orderCreated event is emitted to event queue. Subscribed services consume this event to further processing.

Idempotency Handling

Every subscriber service has to implement idempotency for consuming the events. It is possible that publishing service publishes  the event more than once. If the subscriber has already processed that event before, then subscriber should ensure to not change domain state if the event comes second time.

Usual solution is to pass a unique id in each event. Subscriber then stores the event id in database table ProcessedMessages as unique. If a subscriber consumes the event with the same id, there will be an error when storing that id in the database table.

Conclusion

In this post, I gave a detail account of event sourcing. Event sourcing is a great way to write micro services. Especially, it solves the problem for data consistency. Whenever a state of entity is changed, a new event is added to the list of events. It also helps in avoiding the object-relational impedance mismatch problem.

7 Advantages to Use Test Driven Development

Test-Driven Development (TDD) is a technique to write software by writing tests. This allows developers to be more proactive in their approach to what can break the software. In this post, I show 10 advantages to use test-driven development approach to build better software.

What is Test-Driven Development?

Let’s start with the fundamentals of test-driven development. Basically, it’s a technique to build software. Simply, you write tests for the code you are writing. How is this any different from regular software building?

As a developer, I have been at fault when I started to write code first. I see the problem and my immediate instinct used to be to write code. And then write tests for the code. On the surface, this sounds ok. But there is an imminent flaw. You are thinking backwardly about tests and then later realize that there might be something wrong with your code.

Instead, think about writing your test first. It is definitely not instinctive initially. But once you practice enough, it automatically becomes easier to adapt.

Advantages of Test Driven Development

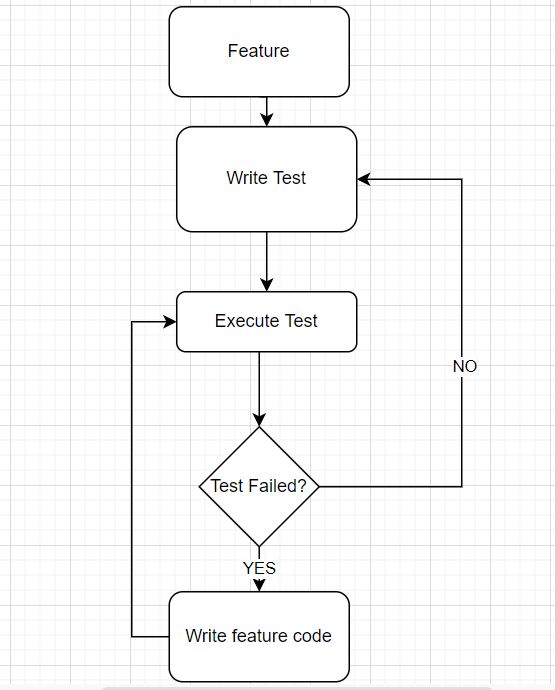
Write the test for the feature you are building. As shown above, in the diagram, the expectation of running the test would be to let that test fail. If the test does not fail, that means your test needs some tweaking. Keep correcting your test till the test fails. Once the test fails, now you have a clear idea of what or how to write your feature code.

Write your feature code and run the tests again till it passes. This allows developers to write modular code in small chunks. Once you have written code to pass the test, you can refactor your old and new code. 

Test-Driven Development is a rigorous process, but one with rewards. Let’s look at what are the other advantages of using this technique to build software. 

Advantages of Test-Driven Development

Here are the 7 advantages of test-driven development.

1. Interface First for the Code

As previously said, sometimes it takes time to adapt to this mindset of writing tests first. But once you start writing tests first, it forces you to think about the interface. This allows separating interface from implementation. 

2. Immediate Feedback

Tests provide immediate feedback about the code you have written. If the tests pass, the feedback is that what you have written is adhering to the business requirements. Sometimes, if you are not able to write the tests, that means you need to deconstruct those requirements.

When actual user scenario, if code breaks, it warrants something our test cases have not covered. Writing tests should be easier and in turn, it should make writing code easier equally.

3. Confidence in Architecture

Unit tests, integration tests, and end-to-end tests provide feedback about the code and how the developers are making sure the code is meeting the business requirements. Depending on how well the tests are written, it provides feedback about the code as well as the architecture of the system. Better the tests, better the coverage for requirements. In short, it increases confidence in architecture. 

4. Refactoring Made Easy

In the book Test Driven Development, Kent Beck pointed out TDD as a process to develop high-quality software. In this process, a developer follows Red Green Refactor.

  • Red – It indicates to write a failing test
  • Green – It indicates writing enough code to pass the test
  • Refactor – Refactor the code you have written and keep the tests intact. 

The last part of refactoring helps in improving the code quality. Making this a process also constantly provides feedback to make refactoring easy. 

5. Reliable Process

TDD is a process. Like everything in software development, processes are great to a certain extent. If you follow the Agile development process, it is good when you have a small team. As soon as the team starts expanding, you can start seeing the cracks in the process. 

TDD is part of an individual software developer’s routine. It is handy and helps in writing quality code. It also helps in getting started with the habit of writing tests. But as you become more proficient in writing tests and software, you can think about making an exception when to not write. 

TDD provides a good feedback loop to improve the software writing process.

6. Easier Documentation

With Test-Driven Development, you write tests, meaningful tests. This provides another advantage of having easier documentation. Any new developer joining can immediately look at tests and understand the requirements. But of course, as the software grows in complexity, it can become harder to maintain the same level of simplicity. That’s why it’s important to follow Test-Driven Development rigorously. 

7. Regression Detection

It is entirely possible that the developer who wrote tests and software did not think of every possible real-life scenario. After all, the software is complex. Something we don’t know, then we don’t know.

A random scenario breaks the software. The developer investigates the issue and finds out the bug. The developer realizes the tests written do not cover the scenario. We have detected the regression. This provides an opportunity to improve the software further by writing another test to fix the regression.

Conclusion

In this post, I showed the advantages of test-driven development. Writing good tests take time, but it is also rewarding. Test-Driven Development provides a good feedback loop to developers to improve the quality of the code. Take some time to learn about test-driven development, it’s worth it.

If you have any questions, you can always send them to me here.

How to Connect to a Database from Spring Boot

In this post, I will show how we can connect to a database from Spring Boot Application. This post will focus on relational databases, but you can also connect MongoDB from Spring Boot application.

Add the database dependency

To connect your Spring Boot application to the database, you can add either of the following dependencies and it will connect to the database.

<dependency>
    <groupdId>org.springframework.boot</groupdId>
    <artifactId>spring-boot-starter-jdbc</artifactId>
    <version>2.6.7</version>
</dependency>

OR if you are a gradle fan like me, you can use this

implementation 'org.springframework.boot:spring-boot-starter-jdbc:2.6.7'

If you use JDBC dependency, then in your code, you will have to use JDBCTemplate to make database calls. This is a nice feature of Spring Boot. Nevertheless, it takes away a good set of segregation in architecture design. To avoid this, we can have a domain layer where we can use repositories to make database calls.

Therefore, another way to connect to the database is to use the JPA dependency.

<dependency>
    <groupdId>org.springframework.boot</groupdId>
    <artifactId>spring-boot-starter-data-jpa</artifactId>
    <version>2.6.7</version>
</dependency>

OR

implementation 'org.springframework.boot:spring-boot-starter-data-jpa:2.6.7'

Spring Data JPA makes it easy to implement JPA-based repositories. You can learn more about Spring Data JPA.

Configure JDBC Database driver

After all, you will be able to call the database through your repository calls if there is a real connection between your app and the database. For this reason, you will need a JDBC driver appropriate to your database. It can be PostgreSQL, MySQL, Microsoft SQL Server, or NoSQL database (like MongoDB OR Cassandra)  driver.

Add the following dependency if you are using PostgreSQL:

<dependency>
    <groupId>org.postgresql</groupId>
    <artifactId>postgresql</artifactId>
    <version>42.3.5</version>
    <scope>runtime</scope>
</dependency>

OR for Gradle

implementation 'org.postgresql:postgresql:42.3.5'

If using MySQL:

<dependency>
    <groupId>mysql</groupId>
    <artifactId>mysql-connector-java</artifactId>
    <version>8.0.29</version>
    <scope>runtime</scope>
</dependency>

Note that we are marking these dependencies for runtime use. Every time your application needs some data, it will call the backend and the backend will connect to the database. During this communication, the driver will come into the picture.

Database connection properties

We have configured our required dependencies. Overall, we need to connect our spring boot application to the database now.  We will set up the database properties for the same. These properties include database URL, username, and password. Most of these properties start with spring.datasource.*.

Depending on what database you are using, the values for the properties will be different. The following section shows the properties of MySQL Database:


spring.datasource.url=jdbc:mysql://127.0.0.1/springbatchdemo
spring.datasource.username = databaseuser
spring.datasource.password = databasepassword
spring.datasource.driver-class-name=com.mysql.cj.jdbc.Driver

These properties help to create a database connection pool. We can then programmatically call database details so our application can connect to the database. There are other datasource properties for Hikari . Hikari is a JDBC Datasource implementation that provides database connection pooling.


spring.datasource.hikari.connection-test-query=SELECT 1
spring.datasource.hikari.maximum-pool-size=50
spring.datasource.hikari.minimum-idle=5
logging.level.com.zaxxer.hikari=DEBUG

Spring Boot uses Hikari by default. You can also use Tomcat for database connection pooling.

Demo – Connect Spring Boot Application to Database

To demonstrate this connection, I have created a simple application called databasedemo. I added the properties as shown above. Obviously, I added some debug logging as well for Hikari.

The main class looks like the below:


package com.betterjavacode.databasedemo;

import org.springframework.boot.SpringApplication;
import org.springframework.boot.autoconfigure.SpringBootApplication;

@SpringBootApplication
public class DatabasedemoApplication {

	public static void main(String[] args) {
		SpringApplication.run(DatabasedemoApplication.class, args);
	}

}

Now, if I start my application, I will see the log that shows our spring boot application connects to the database.


2022-05-15 00:46:48.069  INFO 8324 --- [           main] c.b.d.DatabasedemoApplication            : Starting DatabasedemoApplication using Java 1.8.0_212 on YMALI2019 with PID 8324 (C:\projects\databasedemo\build\classes\java\main started by Yogesh Mali in C:\projects\databasedemo)
2022-05-15 00:46:48.074  INFO 8324 --- [           main] c.b.d.DatabasedemoApplication            : No active profile set, falling back to 1 default profile: "default"
2022-05-15 00:46:48.811  INFO 8324 --- [           main] .s.d.r.c.RepositoryConfigurationDelegate : Bootstrapping Spring Data JPA repositories in DEFAULT mode.
2022-05-15 00:46:48.840  INFO 8324 --- [           main] .s.d.r.c.RepositoryConfigurationDelegate : Finished Spring Data repository scanning in 9 ms. Found 0 JPA repository interfaces.
2022-05-15 00:46:49.324 DEBUG 8324 --- [           main] com.zaxxer.hikari.HikariConfig           : Driver class com.mysql.cj.jdbc.Driver found in Thread context class loader sun.misc.Launcher$AppClassLoader@659e0bfd
2022-05-15 00:46:49.566 DEBUG 8324 --- [           main] com.zaxxer.hikari.HikariConfig           : HikariPool-1 - configuration:
2022-05-15 00:46:49.570 DEBUG 8324 --- [           main] com.zaxxer.hikari.HikariConfig           : allowPoolSuspension................................false
2022-05-15 00:46:49.570 DEBUG 8324 --- [           main] com.zaxxer.hikari.HikariConfig           : autoCommit................................true
2022-05-15 00:46:49.570 DEBUG 8324 --- [           main] com.zaxxer.hikari.HikariConfig           : catalog................................none
2022-05-15 00:46:49.570 DEBUG 8324 --- [           main] com.zaxxer.hikari.HikariConfig           : connectionInitSql................................none
2022-05-15 00:46:49.571 DEBUG 8324 --- [           main] com.zaxxer.hikari.HikariConfig           : connectionTestQuery................................"SELECT 1"
2022-05-15 00:46:49.571 DEBUG 8324 --- [           main] com.zaxxer.hikari.HikariConfig           : connectionTimeout................................30000
2022-05-15 00:46:49.571 DEBUG 8324 --- [           main] com.zaxxer.hikari.HikariConfig           : dataSource................................none
2022-05-15 00:46:49.571 DEBUG 8324 --- [           main] com.zaxxer.hikari.HikariConfig           : dataSourceClassName................................none
2022-05-15 00:46:49.571 DEBUG 8324 --- [           main] com.zaxxer.hikari.HikariConfig           : dataSourceJNDI................................none
2022-05-15 00:46:49.572 DEBUG 8324 --- [           main] com.zaxxer.hikari.HikariConfig           : dataSourceProperties................................{password=}
2022-05-15 00:46:49.572 DEBUG 8324 --- [           main] com.zaxxer.hikari.HikariConfig           : driverClassName................................"com.mysql.cj.jdbc.Driver"
2022-05-15 00:46:49.573 DEBUG 8324 --- [           main] com.zaxxer.hikari.HikariConfig           : exceptionOverrideClassName................................none
2022-05-15 00:46:49.573 DEBUG 8324 --- [           main] com.zaxxer.hikari.HikariConfig           : healthCheckProperties................................{}
2022-05-15 00:46:49.573 DEBUG 8324 --- [           main] com.zaxxer.hikari.HikariConfig           : healthCheckRegistry................................none
2022-05-15 00:46:49.573 DEBUG 8324 --- [           main] com.zaxxer.hikari.HikariConfig           : idleTimeout................................600000
2022-05-15 00:46:49.573 DEBUG 8324 --- [           main] com.zaxxer.hikari.HikariConfig           : initializationFailTimeout................................1
2022-05-15 00:46:49.573 DEBUG 8324 --- [           main] com.zaxxer.hikari.HikariConfig           : isolateInternalQueries................................false
2022-05-15 00:46:49.573 DEBUG 8324 --- [           main] com.zaxxer.hikari.HikariConfig           : jdbcUrl................................jdbc:mysql://127.0.0.1/springbatchdemo?autoReconnect=true&useSSL=false
2022-05-15 00:46:49.573 DEBUG 8324 --- [           main] com.zaxxer.hikari.HikariConfig           : keepaliveTime................................0
2022-05-15 00:46:49.573 DEBUG 8324 --- [           main] com.zaxxer.hikari.HikariConfig           : leakDetectionThreshold................................0
2022-05-15 00:46:49.574 DEBUG 8324 --- [           main] com.zaxxer.hikari.HikariConfig           : maxLifetime................................1800000
2022-05-15 00:46:49.574 DEBUG 8324 --- [           main] com.zaxxer.hikari.HikariConfig           : maximumPoolSize................................10
2022-05-15 00:46:49.574 DEBUG 8324 --- [           main] com.zaxxer.hikari.HikariConfig           : metricRegistry................................none
2022-05-15 00:46:49.574 DEBUG 8324 --- [           main] com.zaxxer.hikari.HikariConfig           : metricsTrackerFactory................................none
2022-05-15 00:46:49.574 DEBUG 8324 --- [           main] com.zaxxer.hikari.HikariConfig           : minimumIdle................................10
2022-05-15 00:46:49.574 DEBUG 8324 --- [           main] com.zaxxer.hikari.HikariConfig           : password................................
2022-05-15 00:46:49.575 DEBUG 8324 --- [           main] com.zaxxer.hikari.HikariConfig           : poolName................................"HikariPool-1"
2022-05-15 00:46:49.575 DEBUG 8324 --- [           main] com.zaxxer.hikari.HikariConfig           : readOnly................................false
2022-05-15 00:46:49.575 DEBUG 8324 --- [           main] com.zaxxer.hikari.HikariConfig           : registerMbeans................................false
2022-05-15 00:46:49.575 DEBUG 8324 --- [           main] com.zaxxer.hikari.HikariConfig           : scheduledExecutor................................none
2022-05-15 00:46:49.575 DEBUG 8324 --- [           main] com.zaxxer.hikari.HikariConfig           : schema................................none
2022-05-15 00:46:49.575 DEBUG 8324 --- [           main] com.zaxxer.hikari.HikariConfig           : threadFactory................................internal
2022-05-15 00:46:49.576 DEBUG 8324 --- [           main] com.zaxxer.hikari.HikariConfig           : transactionIsolation................................default
2022-05-15 00:46:49.576 DEBUG 8324 --- [           main] com.zaxxer.hikari.HikariConfig           : username................................"root"
2022-05-15 00:46:49.576 DEBUG 8324 --- [           main] com.zaxxer.hikari.HikariConfig           : validationTimeout................................5000
2022-05-15 00:46:49.576  INFO 8324 --- [           main] com.zaxxer.hikari.HikariDataSource       : HikariPool-1 - Starting...
2022-05-15 00:46:49.879 DEBUG 8324 --- [           main] com.zaxxer.hikari.pool.HikariPool        : HikariPool-1 - Added connection com.mysql.cj.jdbc.ConnectionImpl@49bf29c6
2022-05-15 00:46:49.882  INFO 8324 --- [           main] com.zaxxer.hikari.HikariDataSource       : HikariPool-1 - Start completed.
2022-05-15 00:46:49.979  INFO 8324 --- [           main] o.hibernate.jpa.internal.util.LogHelper  : HHH000204: Processing PersistenceUnitInfo [name: default]
2022-05-15 00:46:49.984 DEBUG 8324 --- [l-1 housekeeper] com.zaxxer.hikari.pool.HikariPool        : HikariPool-1 - Pool stats (total=1, active=0, idle=1, waiting=0)
2022-05-15 00:46:49.997 DEBUG 8324 --- [onnection adder] com.zaxxer.hikari.pool.HikariPool        : HikariPool-1 - Added connection com.mysql.cj.jdbc.ConnectionImpl@6e7b7614
2022-05-15 00:46:50.008 DEBUG 8324 --- [onnection adder] com.zaxxer.hikari.pool.HikariPool        : HikariPool-1 - Added connection com.mysql.cj.jdbc.ConnectionImpl@2f467c2f
2022-05-15 00:46:50.018 DEBUG 8324 --- [onnection adder] com.zaxxer.hikari.pool.HikariPool        : HikariPool-1 - Added connection com.mysql.cj.jdbc.ConnectionImpl@1ea3f201
2022-05-15 00:46:50.028 DEBUG 8324 --- [onnection adder] com.zaxxer.hikari.pool.HikariPool        : HikariPool-1 - Added connection com.mysql.cj.jdbc.ConnectionImpl@4f698360
2022-05-15 00:46:50.037 DEBUG 8324 --- [onnection adder] com.zaxxer.hikari.pool.HikariPool        : HikariPool-1 - Added connection com.mysql.cj.jdbc.ConnectionImpl@a97f000
2022-05-15 00:46:50.046 DEBUG 8324 --- [onnection adder] com.zaxxer.hikari.pool.HikariPool        : HikariPool-1 - Added connection com.mysql.cj.jdbc.ConnectionImpl@4b27b8a8
2022-05-15 00:46:50.056 DEBUG 8324 --- [onnection adder] com.zaxxer.hikari.pool.HikariPool        : HikariPool-1 - Added connection com.mysql.cj.jdbc.ConnectionImpl@26e87d5e
2022-05-15 00:46:50.065 DEBUG 8324 --- [onnection adder] com.zaxxer.hikari.pool.HikariPool        : HikariPool-1 - Added connection com.mysql.cj.jdbc.ConnectionImpl@19511557
2022-05-15 00:46:50.072 DEBUG 8324 --- [onnection adder] com.zaxxer.hikari.pool.HikariPool        : HikariPool-1 - Added connection com.mysql.cj.jdbc.ConnectionImpl@17cd85b6
2022-05-15 00:46:50.073 DEBUG 8324 --- [onnection adder] com.zaxxer.hikari.pool.HikariPool        : HikariPool-1 - After adding stats (total=10, active=0, idle=10, waiting=0)
2022-05-15 00:46:50.108  INFO 8324 --- [           main] org.hibernate.Version                    : HHH000412: Hibernate ORM core version 5.6.8.Final
2022-05-15 00:46:50.448  INFO 8324 --- [           main] o.hibernate.annotations.common.Version   : HCANN000001: Hibernate Commons Annotations {5.1.2.Final}
2022-05-15 00:46:51.392  INFO 8324 --- [           main] org.hibernate.dialect.Dialect            : HHH000400: Using dialect: org.hibernate.dialect.MySQL5Dialect

Spring Boot offers a DataSource object that you can inject where you want to connect to the database. You can also set all the data source properties programmatically. Besides, now you can either use repositories or jdbcTemplate to fetch any database object from the database. 

Conclusion

In this post, I showed how one can connect a spring boot application to the database. Spring Boot has made this easier by taking away a lot of boilerplate code. This allows developers to focus on business logic and not worry about database-level coding. 

Using Bull Queues in NestJS Application

In many scenarios, you will have to handle asynchronous CPU-intensive tasks. Especially, if an application is asking for data through REST API. REST endpoint should respond within a limited timeframe.

In this post, I will show how we can use queues to handle asynchronous tasks. We will be using Bull queues in a simple NestJS application.

Bull Queue in NestJs

Queues are a data structure that follows a linear order. In most systems, queues act like a series of tasks. A publisher publishes a message or task to the queue. A consumer picks up that message for further processing. This can happen asynchronously, providing much-needed respite to CPU-intensive tasks. Once the consumer consumes the message, the message is not available to any other consumer.

Bull queues are based on Redis. In my previous post, I covered how to add a health check for Redis or a database in a NestJS application.

  • Set up NestJS Application
  • Bull Queues in NestJS Application
  • Implementing a Processor to process queue data
  • Integrating Bull Dashboard
    • Add Bull Board Class
    • Add a Controller
  • Conclusion

Set up NestJS Application

As part of this demo, we will create a simple application. We will upload user data through csv file. A controller will accept this file and pass it to a queue. A processor will pick up the queued job and process the file to save data from CSV file into the database.

nest new bullqueuedemo

Once this command creates the folder for bullqueuedemo, we will set up Prisma ORM to connect to the database. (Note – make sure you install prisma dependencies.).

npx prisma init

If you are using a Windows machine, you might run into an error for running prisma init. All things considered, set up an environment variable to avoid this error.

set PRISMA_CLI_QUERY_ENGINE_TYPE=binary

set PRISMA_CLIENT_ENGINE_TYPE=binary

Once the schema is created, we will update it with our database tables. For this demo, we are creating a single table user.

// This is your Prisma schema file,
// learn more about it in the docs: https://pris.ly/d/prisma-schema

generator client {
  provider = "prisma-client-js"
  engineType = "binary"
}

datasource db {
  provider = "mysql"
  url      = env("DATABASE_URL")
}


model User {
  id    Int     @default(autoincrement()) @id
  email String  @unique
  first_name  String
  last_name   String?
}

Now if we run npm run prisma migrate dev, it will create a database table.

In summary, so far we have created a NestJS application and set up our database with Prisma ORM. Let’s look at the configuration we have to add for Bull Queue.

Bull Queues in NestJS Application

Install @nestjs/bull dependency. This dependency encapsulates the bull library. We will assume that you have redis installed and running. By default, Redis will run on port 6379.

We will add REDIS_HOST and REDIS_PORT as environment variables in our .env file. Install two dependencies for Bull as follows:

npm install @nestjs/bull

npm install @types/bull

Afterward, we will set up the connection with Redis by adding BullModule to our app module.

@Module({
  imports: [
    BullModule.forRootAsync({
      imports: [ConfigModule],
      useFactory: async (configService: ConfigService) => ({
        redis: {
          host: configService.get('REDIS_HOST'),
          port: Number(configService.get('REDIS_PORT')),
        },
      }),
      inject: [ConfigService]
    }),
    BullModule.registerQueue({
      name: 'file-upload-queue'
    }), 
  ],
  controllers: [AppController, BullBoardController],
  providers: [UserService, PrismaService, FileUploadProcessor,],
})
export class AppModule {}

We are injecting ConfigService. This service allows us to fetch environment variables at runtime. With this, we will be able to use BullModule across our application.

As you can see in the above code, we have BullModule.registerQueue and that registers our queue file-upload-queue. Let’s now add this queue in our controller where will use it.

@Controller('/api/bullqueuedemo')
export class AppController {
  constructor(@InjectQueue('file-upload-queue') private fileQueue: Queue) {
    queuePool.add(fileQueue);
  }

  @Post('/uploadFile')
  @UseInterceptors(FileInterceptor("csv", {
    storage: diskStorage({
      destination: './csv',
      fileName: (req, file, cb) => {
        const randomName = Array(32).fill(null).map(() => (Math.round(Math.random() * cb(null, `${randomName}${extname(file.originalname)}`))))
      }
    })
  }))
  async uploadCsvFile(@UploadedFile() file): Promise {
    const job = await this.fileQueue.add('csvfilejob', {file: file});
    console.log(`created job ${ job.id}`);
  }

  @Get('/')
  async getHello(): Promise {
    return "Hello World";
  }
}

Let’s go over this code slowly to understand what’s happening.

  • In the constructor, we are injecting the queue InjectQueue('file-upload-queue').
  • Our POST API is for uploading a csv file.
  • We are using a FileInterceptor. This is a feature that NestJS offers to intercept the request and extract files from the request. This interceptor takes two arguments fieldName and options.
  • storage option allows us to store the uploaded file in a folder called csv in the current directory of execution. The uploaded file will be renamed with a randomly generated name and extension .csv.
  • In the method uploadCsvFile, we receive the uploaded file. This comes from our FileInterceptor. We use our injected queue to add a job with a name csvfilejob and data containing the file.

Implementing a Processor to process Queue data

Thereafter, we have added a job to our queue file-upload-queue. Now to process this job further, we will implement a processor FileUploadProcessor.

We will annotate this consumer with @Processor('file-upload-queue').

@Processor('file-upload-queue')
export class FileUploadProcessor {

    constructor(private readonly userService: UserService){}

    @Process('csvfilejob')
    async processFile(job: Job) {
        const file = job.data.file;
        const filePath = file.path;
        const userData = await csv().fromFile(filePath);

        console.log(userData);

        for(const user of userData) {
            const input = {
                email: user.email,
                first_name: user.first_name,
                last_name: user.last_name,
            };
            const userCreated = await this.userService.createUser(input);
            console.log('User created -', userCreated.id );
        }

    }
    
}

Shortly, we can see we consume the job from the queue and fetch the file from job data. Note that we have to add @Process(jobName) to the method that will be consuming the job. processFile method consumes the job. We convert CSV data to JSON and then process each row to add a user to our database using UserService.

Once you create FileUploadProcessor, make sure to register that as a provider in your app module.

To show this, if I execute the API through Postman, I will see the following data in the console:

[Nest] 21264  - 04/22/2022, 4:57:19 PM     LOG [NestFactory] Starting Nest application...
[Nest] 21264  - 04/22/2022, 4:57:20 PM     LOG [InstanceLoader] DiscoveryModule dependencies initialized +43ms
[Nest] 21264  - 04/22/2022, 4:57:20 PM     LOG [InstanceLoader] ConfigHostModule dependencies initialized +0ms
[Nest] 21264  - 04/22/2022, 4:57:20 PM     LOG [InstanceLoader] BullModule dependencies initialized +4ms
[Nest] 21264  - 04/22/2022, 4:57:20 PM     LOG [InstanceLoader] ConfigModule dependencies initialized +0ms
[Nest] 21264  - 04/22/2022, 4:57:20 PM     LOG [InstanceLoader] BullModule dependencies initialized +12ms
[Nest] 21264  - 04/22/2022, 4:57:20 PM     LOG [InstanceLoader] BullModule dependencies initialized +10ms
[Nest] 21264  - 04/22/2022, 4:57:20 PM     LOG [InstanceLoader] AppModule dependencies initialized +1ms
[Nest] 21264  - 04/22/2022, 4:57:20 PM     LOG [RoutesResolver] AppController {/api/bullqueuedemo}: +62ms
[Nest] 21264  - 04/22/2022, 4:57:20 PM     LOG [RouterExplorer] Mapped {/api/bullqueuedemo/uploadFile, POST} route +3ms
[Nest] 21264  - 04/22/2022, 4:57:20 PM     LOG [RouterExplorer] Mapped {/api/bullqueuedemo, GET} route +1ms
[Nest] 21264  - 04/22/2022, 4:57:20 PM     LOG [NestApplication] Nest application successfully started +582ms
created job 2
[
  {
    id: '1',
    email: 'john.doe@gmail.com',
    first_name: 'John',
    last_name: 'Doe'
  },
  {
    id: '2',
    email: 'jacob.drake@gmail.com',
    first_name: 'Jacob',
    last_name: 'Drake'
  },
  {
    id: '3',
    email: 'jos.butler@gmail.com',
    first_name: 'Jos',
    last_name: 'Butler'
  }
]
User created - 1
User created - 2
User created - 3

Bull queues offer a number of features:

  • Minimal CPU usage
  • Robust design based on redis
  • Concurrency
  • Retry
  • Rate limiter
  • Event monitoring

One question that constantly comes up is how do we monitor these queues if jobs fail or are paused. A simple solution would be using Redis CLI, but Redis CLI is not always available, especially in Production environments. Finally, comes a simple UI-based dashboard – Bull Dashboard.

Integrating Bull Dashboard

The great thing about Bull queues is that there is a UI available to monitor the queues. One can also add some options that can allow a user to retry jobs that are in a failed state. Let’s install two dependencies @bull-board/express and @bull-board/api .

npm install @bull-board/express – This installs an express server-specific adapter. If you are using fastify with your NestJS application, you will need @bull-board/fastify.

npm install @bull-board/api – This installs a core server API that allows creating of a Bull dashboard.

Add Bull Board Class

We will create a bull board queue class that will set a few properties for us. It will create a queuePool. This queuePool will get populated every time any new queue is injected. We will also need a method getBullBoardQueuesto pull all the queues when loading the UI.


@Injectable()
export class BullBoardQueue { }

export const queuePool: Set = new Set();

export const getBullBoardQueues = (): BaseAdapter[] => {
    const bullBoardQueues = [...queuePool].reduce((acc: BaseAdapter[], val) => {
        acc.push(new BullAdapter(val))
        return acc
    }, []);

    return bullBoardQueues
}

Add a controller

There are a couple of ways we could have accessed UI, but I prefer adding this through a controller, so my frontend can call the API. We create a BullBoardController to map our incoming request, response, and next like Express middleware. In our path for UI, we have a server adapter for Express. This allows us to set a base path. We fetch all the injected queues so far using getBullBoardQueuesmethod described above. We then use createBullBoardAPI to get addQueue method. serverAdapterhas provided us with a router that we use to route incoming requests. Before we route that request, we need to do a little hack of replacing entryPointPath with /.


@Controller('/queues/admin')
export class BullBoardController{
    
    @All('*')
    admin(
        @Request() req: express.Request,
        @Response() res: express.Response,
        @Next() next: express.NextFunction,
    ) {
        const serverAdapter = new ExpressAdapter();
        serverAdapter.setBasePath('/queues/admin');
        const queues = getBullBoardQueues();
        const router = serverAdapter.getRouter() as express.Express;
        const { addQueue } = createBullBoard({
            queues: [],
            serverAdapter,
        });
        queues.forEach((queue: BaseAdapter) => {
            addQueue(queue);
        });
        const entryPointPath = '/queues/admin/';
        req.url = req.url.replace(entryPointPath, '/');
        router(req, res, next);
    }
}

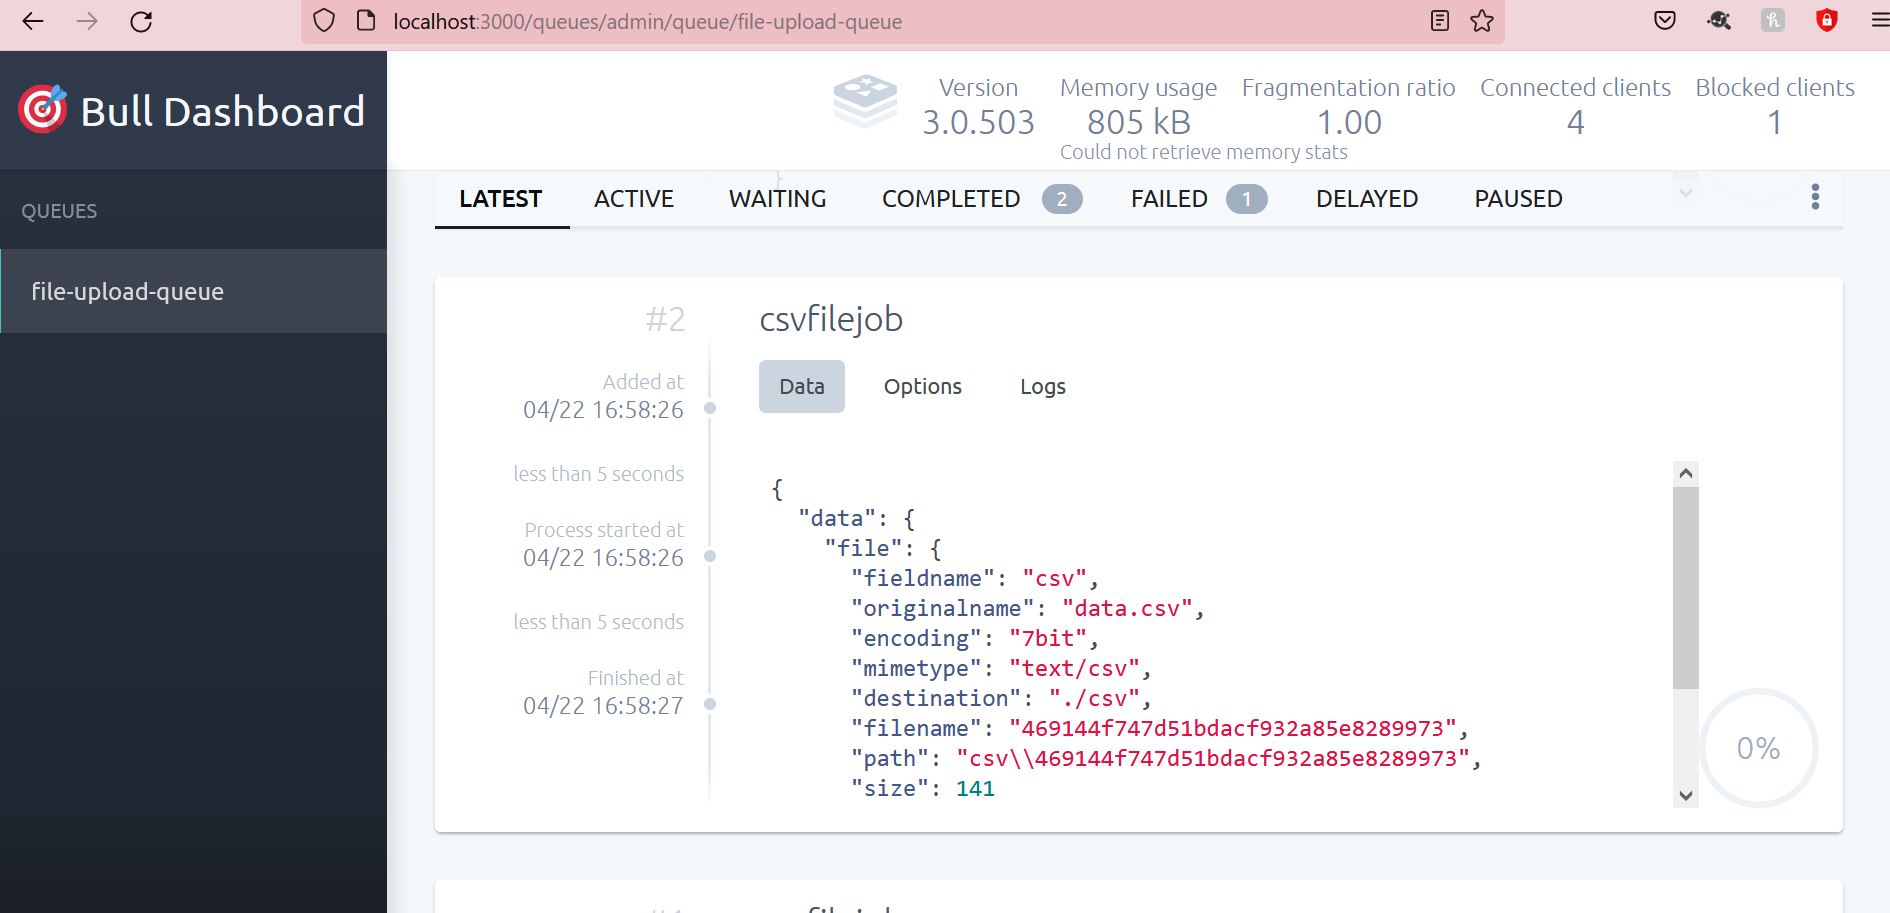
Now if we run our application and access the UI, we will see a nice UI for Bull Dashboard as below:
Bull Queues NestJS Application - Dashboard

Finally, the nice thing about this UI is that you can see all the segregated options.

Conclusion

Bull queues are a great feature to manage some resource-intensive tasks. In this post, we learned how we can add Bull queues in our NestJS application. We also easily integrated a Bull Board with our application to manage these queues. The code for this post is available here.

Do you want to read more posts about NestJS? Send me your feedback here.

Adding Health checks in NestJS Application

The health check endpoint provides the details of how our application is doing. In this post, we will show how to add health checks to your NestJS application. If you want to learn about enabling CORS in your NestJS application, you can read more about it here.

Why add Health Checks?

Once you build and deploy your application, you need to know if your application is running smoothly in an easier way without making some application business logic calls. Health checks offer a way to check if the database is running smoothly, your storage disk is fine, and your application service is executing as intended.

The most important reason you need health checks is so you can continue to monitor your application. A metrics collection service (like Micrometer) can continue to validate the application. It can verify that there are no software or hardware failures. Any moment, there is any software or hardware failure, it can trigger a notification for manual or automatic intervention to get the application back on track. This improves the reliability of the application.

Health checks in NestJS Application

In NestJS framework, Terminus library offers a way to integrate readiness/liveness health checks. A service or component of infrastructure will continuously hit a GET endpoint. Service will take action based on the response.

Let’s get started. We will add the terminus library to our NestJS application.

npm install @nestjs/terminus.

Terminus integration offers graceful shutdown as well Kubernetes readiness/liveness check for http applications. Liveness check tells if the container is up and running. A readiness check tells if the container is ready to accept incoming requests.

We will also set up a number of checks for database, memory, disk, and redis in this post to show how health checks work.

How to set up a Health check in NestJS?

Once we have added nestjs/terminus package, we can create a health check endpoint and include some predefined indicators. These indicators include HTTP check, Database connectivity check, Memory and Disk check.

Depending on what ORM, you are using, nestjs offers some inbuilt packages like TypeORM or Sequlize health check indicators.

The health check will provide us with a combination of indicators. This set of indicators provides us with information to indicate how our application is doing.

DiskHealthIndicator

Let’s start with how the server’s hard disk is doing.

DiskHealthIndicator contains the check for disk storage of the current machine.

Once we add DiskHealthIndicator in our health controller, we will check for storage as follows:

this.disk.checkStorage('diskStorage', { thresholdPercent: 0.5, path: 'C:\\'});

HttpHealthIndicator

HttpHealthIndicator will provide the details of our HTTP application and if it is up and running. Explicitly, we will add @nestjs/axios package to our project.

npm install @nestjs/axios.

Additionally. we will use pingCheck method to verify if we are able to connect to the application.

this.http.pingCheck('Basic check', 'http://localhost:3000');

MemoryHealthIndicator

Overall, MemoryHealthIndicator provides the details of the memory of the machine on which the application is running.

this.memory.checkHeap('memory_heap', 300*1024*1024);

this.memory.checkRSS('memory_rss',300*1024*1024);

Database Health Check

Assuming your application is using a database, you will need a database health check. Subsequently,  nestjs/terminus provides database health check through ORM packages like TypeORM, Sequelize, or Mongoose. As part of this demo, we will create a custom database health check since we use Prisma ORM.

NestJS Application

In any case, let’s create nestjs application with nestjs/cli.

nest new healthcheckdemo.

As previously stated, we will use Prisma ORM.

npm install prisma --save-dev.

This will install Prisma cli. Now if we run npx prisma init , it will create a barebone of schema.prisma file where we will create our database model schema.

In this application, I am using a simple schema where a user can sign up to create posts. I am also using the MySQL database. This schema will look like the below:

// This is your Prisma schema file,
// learn more about it in the docs: https://pris.ly/d/prisma-schema

generator client {
  provider = "prisma-client-js"
  engineType = "binary"
}

datasource db {
  provider = "mysql"
  url      = env("DATABASE_URL")
}

model User {
  id    Int     @default(autoincrement()) @id
  email String  @unique
  name  String?
  posts Post[]
}

model Post {
  id        Int      @default(autoincrement()) @id
  title     String
  content   String?
  published Boolean? @default(false)
  author    User?    @relation(fields: [authorId], references: [id])
  authorId  Int?
}

By default, Prisma will create .env file if it was not there before. It will also add a default variable for DATABASE_URL.

If we run npm run prisma migrate dev, it will create those database tables in our DB.

Further, let’s create an app module in our sample application for healthcheckdemo.

import { Module } from '@nestjs/common';
import { PrismaClient } from '@prisma/client';
import { AppController } from './app.controller';
import { AppService } from './app.service';
import { UserService } from './user.service';
import { HealthModule } from './health/health.module';
import { HttpModule } from '@nestjs/axios';
import { PrismaService } from './prisma.service';

@Module({
  imports: [HealthModule, HttpModule],
  controllers: [AppController],
  providers: [AppService, UserService, PrismaClient, PrismaService,],
})
export class AppModule {}

We will also create HealthModule that will serve the purpose for the HealthController.

import { Module } from '@nestjs/common';
import { TerminusModule } from '@nestjs/terminus';
import { PrismaService } from 'src/prisma.service';

import { HealthController } from './health.controller';
import { PrismaOrmHealthIndicator } from './prismaorm.health';

@Module({
  imports: [
    TerminusModule,   
  ],
  controllers: [HealthController],
  providers: [ PrismaOrmHealthIndicator, PrismaService]
})
export class HealthModule {}

In this HealthModule, you will notice there is PrismaOrmHealthIndicator. Before we dive into PrismaOrmHealthIndicator, we need to generate Prisma Client .

npm install @prisma/client will generate the Prisma client for your database model. This will expose CRUD operations for your database model, making it easier for developers to focus on business logic rather than how to access data from a database.

We will abstract away Prisma Client APIs to create database queries in a separate service PrismaService. This service will also instantiate Prisma Client.


import { INestApplication, Injectable, OnModuleInit } from '@nestjs/common';
import { PrismaClient } from '@prisma/client';

@Injectable()
export class PrismaService extends PrismaClient implements OnModuleInit {
  async onModuleInit() {
    await this.$connect();
  }

  async enableShutdownHooks(app: INestApplication) {
    this.$on('beforeExit', async () => {
      await app.close();
    });
  }
}

There is a documented issue with enableShutdownHooks. We will use enableShutdownHooks call when closing the application.

Health Controller

For a health check, we will need a health controller. We talked about the health module in the previous section, There are two important pieces left before we show how the health check will look.

Let’s create a health controller.

nest g controller health

This will generate a controller for us.

import { Controller, Get, Inject } from '@nestjs/common';
import { DiskHealthIndicator, HealthCheck, HealthCheckService, HttpHealthIndicator, MemoryHealthIndicator, MicroserviceHealthIndicator } from '@nestjs/terminus';
import { PrismaOrmHealthIndicator } from './prismaorm.health';


@Controller('health')
export class HealthController {
    constructor(
        private health: HealthCheckService,
        private http: HttpHealthIndicator,
        @Inject(PrismaOrmHealthIndicator)
        private db: PrismaOrmHealthIndicator,
        private disk: DiskHealthIndicator,
        private memory: MemoryHealthIndicator,        
    ) {}

  @Get()
  @HealthCheck()
  check() {
    return this.health.check([
      () => this.http.pingCheck('basic check', 'http://localhost:3000'),
      () => this.disk.checkStorage('diskStorage', { thresholdPercent: 0.5, path: 'C:\\'}),
      () => this.db.pingCheck('healthcheckdemo'),
      () => this.memory.checkHeap('memory_heap', 300*1024*1024),
      () => this.memory.checkRSS('memory_rss', 300*1024*1024),
      
      // Mongoose for MongoDB check
      // Redis check
    ]);
  }
}

In the health controller, we have a GET endpoint /health to provide details of how our application, memory of the machine, storage disk, and databases are doing. NestJs do not offer any ORM Health indicator for Prisma. So I am writing a custom indicator to find out database health.

By and large, this custom Prisma health indicator will be:


import { Injectable, InternalServerErrorException } from "@nestjs/common";
import { HealthIndicator, HealthIndicatorResult } from "@nestjs/terminus";
import { PrismaService } from "src/prisma.service";


@Injectable()
export class PrismaOrmHealthIndicator extends HealthIndicator {
    constructor(private readonly prismaService: PrismaService) {
        super();
    }

    async pingCheck(databaseName: string): Promise {
        try {
            await this.prismaService.$queryRaw`SELECT 1`;
            return this.getStatus(databaseName, true);
        } catch (e) {
            throw new InternalServerErrorException('Prisma check failed', e);
        }
    }
}

We are extending the abstract class HealthIndicator and implementing a method called pingCheck in this PrismaOrmHealthIndicator class. This method uses PrismaService to query the database that has been passed. We use SELECT 1 query. If the query is successful, we get the database status as true.

Also, note that this class PrismaOrmHealthIndicator is injectable and we are injecting that in our HealthController.

Now if we start the application and execute the endpoint, we will get the response as below:


{
  "status": "ok",
  "info": {
    "basic check": {
      "status": "up"
    },
    "diskStorage": {
      "status": "up"
    },
    "healthcheckdemo": {
      "status": "up"
    },
    "memory_heap": {
      "status": "up"
    },
    "memory_rss": {
      "status": "up"
    }
  },
  "error": {},
  "details": {
    "basic check": {
      "status": "up"
    },
    "diskStorage": {
      "status": "up"
    },
    "healthcheckdemo": {
      "status": "up"
    },
    "memory_heap": {
      "status": "up"
    },
    "memory_rss": {
      "status": "up"
    }
  }
}

As you can see, everything seems to be running fine. healthcheckdemo is the database name that I am using in MySQL.

Similarly, we can also add redis and mongoose as part of health checks in our NestJS application.

Conclusion

In this post, we create a simple NestJS application to demonstrate how to add health checks. The code for this post is available here.

If you have any feedback for this post OR my book Simplifying Spring Security, I would love to hear your feedback.