As part of building the web application Social KPI SocialPie, we will be building the backend and frontend in module forms. Eventually, the plan is to deploy the application on the cloud. But backend and frontend are not different services as Microservice architecture generally dictates. In this post, I will show how we will be building a user interface for Social KPI using thymeleaf and angular JS.
The idea is to create a skeleton of UI by bringing different points in the discussion to make our decisions about choosing different parts of UI. In the previous post here, we discussed user flow.
User Story for user interface
- A user will access the application and will see the initial screen for login or sign up.
- If the user has not signed up before, he will sign up with the first name, last name, email, company name, password.
- Once the user signs up, the user will receive a confirmation email to sign in. This user will be the administrator to manage its company.
- A user can come back to the login screen through confirmation email. Then the user will enter credentials.
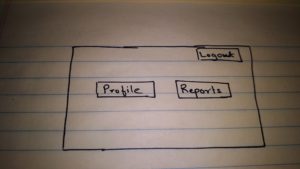
- User will see the company profile. User will have the option to modify company profile details as well as to add users with role REPORT.
- Administrator when adding these users will submit their first name, last name, email, and role as REPORT. Administrator will have an option to send emails to these users through portal or provide them username and password.
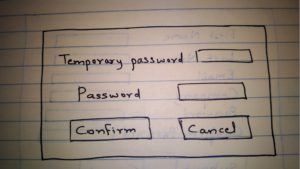
- Once the users with role REPORT login, they will have the option to change their temporary password. Once the password has been changed, he will be redirected to the reports screen.
- Administrator can also access reports screen any time.
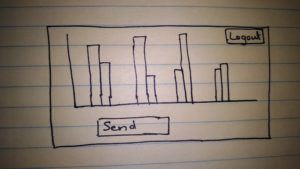
- On Reports screen, user will have an option to synchronize the data with social media APIs to get the latest data. This will be once in a day option considering the limitation on access of APIs.
- On Reports screen, user will have an option to generate the report post-synchronization. User will be able to see Jasper reports in graph as well in data form. User will have an option to send these reports to other people in email.
- There will be logout and home screen options on the screen all the time.
- Home for user with Report role will be their profile information.
The skeleton of the user interface
Screen 1:
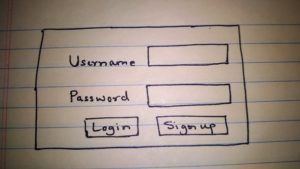
First Page
Screen 2:
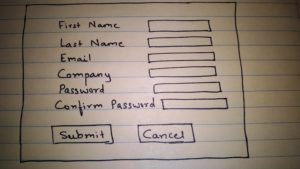
Second Page
Screen 3:
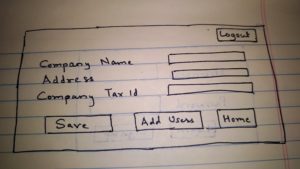
Third Page
Screen 4:
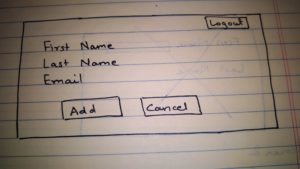
Forth Page
Screen 5:
Fifth Page
Screen 6:
Sixth Page
Screen 7:
Seventh Page
Conclusion
In this post, we showed the skeleton of the user interface for the Social KPI web application. Of course, this is not a final design, but as we go on building it, we will have our changes and I will also show the code for this design. In future posts, I will be showing the functioning UI for login and sign-up pages.